
Fibonacci retracement is one of the most widely used chart tools for spotting pullback levels, possible trend continuation zones, and price areas where buyers or sellers may return. For traders in the UAE and wider MENA region, it can be useful because it adds structure to fast-moving markets without requiring overly complex indicators. Still, it works best as a decision-support tool, not as a prediction machine. If you are still building your chart-reading skills, our technical analysis guide offers the broader context. In this article, you will learn what fibonacci retracement levels are, how traders apply them in forex and other markets, where the tool often goes wrong, and how to combine it with confirmation methods so your analysis stays grounded in risk management rather than hope.
What Fibonacci Retracement Means
Fibonacci retracement is a charting tool that plots percentage-based levels between a meaningful swing low and swing high, or vice versa in a downtrend. Traders use these levels to estimate where price may pause, reverse, or continue after a pullback.
The most common idea behind the tool is simple. Markets rarely move in a straight line. Even strong trends usually retrace part of the prior move before continuing. Fibonacci retracement levels attempt to map those pullbacks in a consistent way.
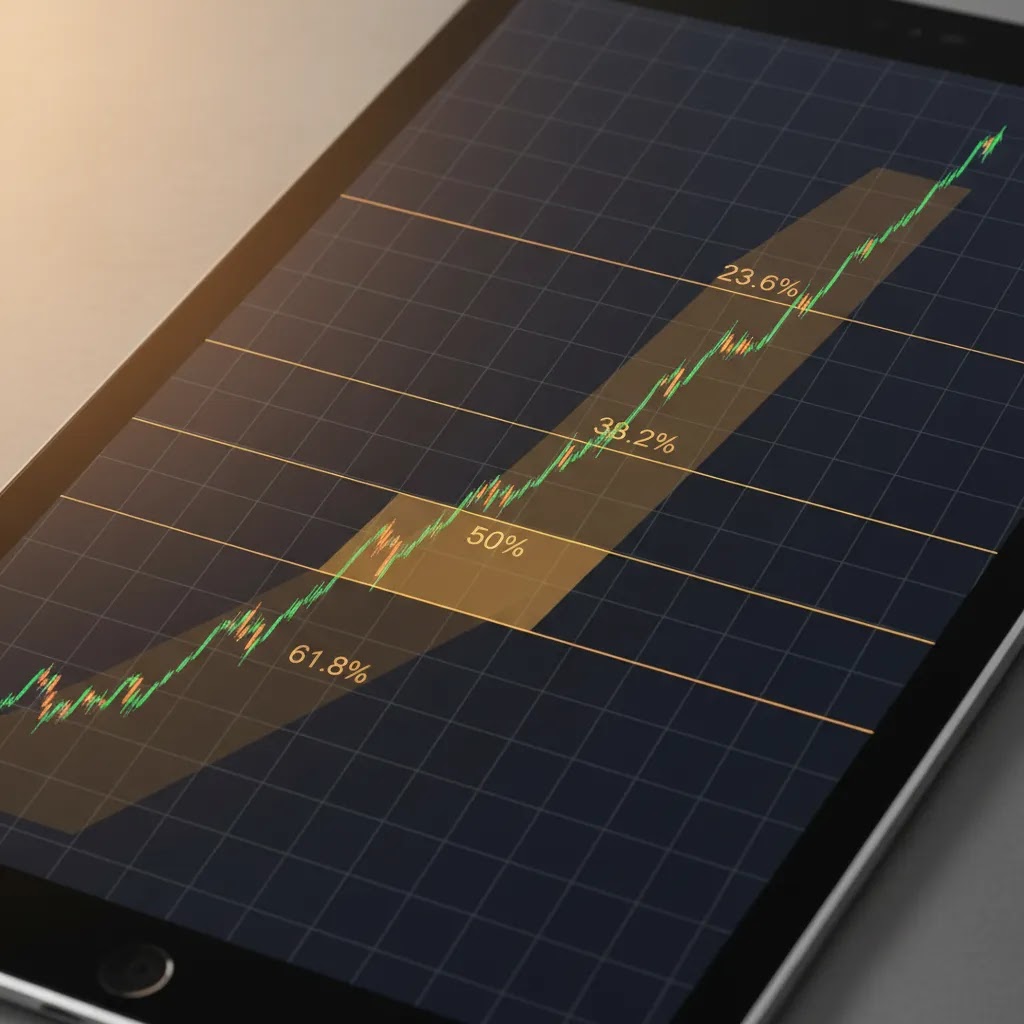
The levels are derived from the Fibonacci sequence and related ratios, especially 23.6%, 38.2%, 50%, 61.8%, and 78.6%. Of these, 61.8% is often treated as the key level because it is closely tied to the so-called golden ratio. In practice, traders often use fibonacci retracement alongside support and resistance, trendlines, moving averages, and candlestick behavior rather than on its own.
This matters because a retracement line by itself does not confirm intent. It only marks areas where price may react. The real edge, if there is one, usually comes from combining those zones with trend structure, volume context, and disciplined risk control.
The Fibonacci Sequence and Why Ratios Like 0.618 Matter
The Fibonacci sequence is a simple number series: 0, 1, 1, 2, 3, 5, 8, 13, 21, and so on. After the first few numbers, each new number is created by adding the two previous numbers. Traders care less about the numbers themselves and more about what happens when you divide them into each other.
Here’s the thing: as the sequence progresses, the ratio between neighboring numbers starts to stabilize. If you divide a number by the one before it, the result tends to approach about 1.618. If you divide a number by the one after it, the result tends to approach about 0.618. That 0.618 figure is why you will often see the 61.8% retracement level presented as a core reference point in trading.
The same logic is used for other popular levels. The 38.2% retracement is essentially 0.382, which comes from dividing a Fibonacci number by the number two places ahead in the sequence as it grows. The 23.6% retracement comes from dividing a number by the number three places ahead. Over time, traders turned these repeating relationships into standardized percentages that can be plotted between a swing low and swing high.
Why is 61.8% called the golden ratio? In math and design, the 1.618 (and its inverse 0.618) shows up in many proportional relationships, which is why it became known as the “golden ratio.” In markets, it is better to treat 61.8% as a commonly watched behavior framework, not a law of price. From a practical standpoint, fibonacci ratios tend to work best as areas of interest that you confirm with structure and price action, not as automatic bounce points.
The Main Fibonacci Retracement Levels
Most charting platforms will automatically display a default set of fibonacci retracement levels. These are the ones traders typically focus on:
- 23.6%: A shallow retracement, often seen in very strong trends where momentum stays aggressive.
- 38.2%: A moderate pullback level that many traders treat as an early continuation zone.
- 50%: Not a true Fibonacci ratio, but widely used because markets often retrace about half of a move.
- 61.8%: The most watched fibonacci level and the main golden ratio trading reference point.
- 78.6%: A deeper retracement that may still preserve the broader trend if price holds.
There is also a related concept called fibonacci extension, which projects potential targets beyond the original swing. While retracement looks at pullbacks within the move, extension looks at where the next impulse could travel if the trend resumes.
These levels should be treated as zones, not exact prices. In real markets, price may react a few points or pips above or below a level. That is why many traders refer to fibonacci zones rather than single-line signals.
The Full Set of Fibonacci Levels Traders Commonly Use (Including 0%, 100%, and 161.8%)
Many traders use more than the five retracement ratios listed above, even if those are the most common. Most platforms also show the “bookend” levels, which are simply:
- 0%: the start of the measured move (your first swing point)
- 100%: the end of the measured move (your second swing point)
Think of it this way: 0% and 100% are not pullback levels, but they anchor the entire measurement so you can see exactly what price swing your retracement tool is referencing. This is also why some traders talk about “the 7 fibonacci levels.” In many cases they mean 0%, 23.6%, 38.2%, 50%, 61.8%, 78.6%, and 100%.
There is some variation in how people count the “standard” set because charting tools can differ. Some traders add 78.6% and stop there, while others include deeper retracement levels like 88.6%. Some traders focus less on deeper retracements and instead add common extension ratios such as 127.2% and 161.8% for target mapping beyond the original swing.
Now, when it comes to how these extra levels are used, the distinction is usually straightforward. Retracement levels are used to frame pullbacks within the move, while extension levels are used as potential reference zones if price breaks past the prior high or low and the trend continues. These are still estimates, not promises. Price can stall early, overshoot, or ignore the levels entirely, especially in fast markets or news-driven sessions.
How to Use Fibonacci Retracement on a Chart
If you are learning how to use fibonacci retracement, start with the most important rule: choose clear, meaningful swing points. In an uptrend, draw the tool from the swing low to the swing high. In a downtrend, draw it from the swing high to the swing low.
Once the levels appear, look for price to retrace into one of the key zones. Then ask a few practical questions:
- Is the broader trend still intact?
- Does the retracement level line up with prior market structure?
- Is there confirming price action such as rejection wicks, engulfing candles, or consolidation breakout behavior?
- Does the setup fit the market session and volatility conditions?
This is where knowledge of chart patterns becomes useful. A fibonacci 61.8 level that also overlaps with a prior breakout zone or continuation pattern may carry more analytical weight than an isolated retracement line.
Some traders use a fibonacci calculator to estimate levels manually, but most modern trading platforms already include the tool. The more important question is not the math. It is whether the selected swing is relevant enough that other market participants may be watching the same area.

Step-by-Step Example: How Fibonacci Retracement Works on a Real Price Move
Consider this hypothetical uptrend move in a currency pair. Price rallies from a swing low at 1.2000 up to a swing high at 1.2500. The total move is 0.0500, which is 500 pips. If you plot fibonacci retracement from 1.2000 to 1.2500, the key pullback levels are calculated by applying the ratio to the size of the move, then subtracting it from the swing high.
Using that example:
- 38.2% retracement: 0.0500 x 0.382 = 0.0191. Level is 1.2500 – 0.0191 = about 1.2309.
- 50% retracement: 0.0500 x 0.50 = 0.0250. Level is 1.2500 – 0.0250 = 1.2250.
- 61.8% retracement: 0.0500 x 0.618 = 0.0309. Level is 1.2500 – 0.0309 = about 1.2191.
In practice, traders typically treat 1.2309, 1.2250, and 1.2191 as zones rather than exact pip-perfect prices. They might then look for confirmation, such as the pullback slowing down, a rejection wick off the zone, or a break back above a nearby structure level that aligns with the fibonacci area. Invalidation is often placed beyond the swing point or beyond the structure that would indicate the trend is no longer intact, but exact placement depends on the trading plan and risk limits.
The reality is that fibonacci retracements do not “hold” automatically. A common failure mode is when price slices through multiple levels with very little reaction, for example it drops through 38.2%, then 50%, then 61.8% in one strong sell-off. When that happens, it can be a sign that the original trend is weakening, volatility has shifted, or a catalyst is driving price more than technical levels. That is why confirmation and position sizing matter as much as the ratios themselves.
A Practical Fibonacci Trading Strategy
A basic fibonacci trading strategy usually starts with trend identification. You first define whether the market is making higher highs and higher lows, or lower highs and lower lows. Then you wait for a pullback into a key retracement zone rather than chasing price after a large move.
A simple process could look like this:
- Identify a clean trend on your chosen time frame.
- Draw fibonacci retracement from the main swing low to swing high in an uptrend, or the reverse in a downtrend.
- Mark the 38.2%, 50%, and 61.8% levels as your main watch zones.
- Wait for price action confirmation rather than entering automatically on touch.
- Place a stop based on invalidation, not emotion.
- Use prior highs or fibonacci extension levels as possible target references.
For example, in an uptrend, a trader may wait for price to pull back into the 50% to 61.8% zone, then look for a bullish candle pattern or strong rejection. If the structure remains intact, that setup may offer a clearer risk-to-reward profile than entering late.
This approach can be adapted for short-term traders as well, but time frame matters. If you are active intraday, understanding day trading vs swing trading style differences can help you avoid applying swing-based levels too aggressively on noisy lower charts.
No fibonacci strategy is reliable on every chart. In ranging markets, weak trends, or highly news-driven sessions, retracement levels may fail repeatedly. That is why the tool should support a plan, not replace one.
Examples of Fibonacci Retracement in Practice
In forex, fibonacci retracement is often used after a strong impulse in major pairs such as EUR/USD or GBP/USD. A trader may identify a clear bullish move, then map the retracement levels and watch whether the 38.2% or 61.8% area overlaps with previous support. If price rejects that zone and resumes upward momentum, the trader may view it as a continuation setup.
In stock or index trading, the same logic applies. After a breakout, price often revisits the breakout area. If that revisit also aligns with a fibonacci level, it may strengthen the support case, although it still does not guarantee a bounce.
Commodities and crypto can also respond to fibonacci levels, but volatility is often higher. That means wider zones, more false breaks, and a greater need for position sizing discipline. A level can be analytically interesting and still produce a losing trade.
One useful habit is to review failed setups. If price slices cleanly through 38.2%, 50%, and 61.8% without meaningful response, that may tell you the original trend assumption was weak or already changing.

Platforms That Support Fibonacci Analysis
If you plan to use fibonacci retracement regularly, platform usability matters. The tool is available on many modern trading platforms, but chart quality, order entry, and market access vary widely. For UAE-based readers, regulatory status also deserves close attention. Brokers regulated by bodies such as the DFSA or SCA may offer an added layer of oversight compared with firms operating outside recognized frameworks.
Here are a few examples from Business24-7 coverage:
| Platform | Starting Costs | Key Charting Access | Regulation | Notable Consideration |
|---|---|---|---|---|
| Pepperstone | From 0.0 pips on Razor, $7/lot commission | MT4, MT5, cTrader, TradingView | DFSA, FCA, ASIC, CySEC, BaFin | No minimum deposit, but advanced pricing may suit active traders more than complete beginners |
| XTB | From 0.1 pips | xStation 5, Mobile App | DFSA, FCA, CySEC, KNF | $0 minimum deposit and strong education, though instrument structure differs by market |
| Capital.com | From 0.6 pips, $20 minimum deposit | Capital.com Web, Mobile App, MT4 | SCA, FCA, CySEC, ASIC | Low entry cost and SCA regulation, but spread-only pricing still needs careful review |
| Interactive Brokers | From 0.25 pips, $0 minimum deposit | TWS, IBKR Mobile, Client Portal | DFSA, SEC, FCA, SFC | Very broad market access, though the platform may feel complex for newer retail traders |
| AvaTrade | From 0.9 pips, $100 minimum deposit | MT4, MT5, AvaTradeGO, WebTrader | ADGM FSRA, CBI, ASIC, FSA Japan | ADGM-regulated presence and useful education, but inactivity fee applies after 3 months |
Business24-7 reviews platforms using practical criteria such as regulation, fees, tools, and user suitability. If you are comparing charting-friendly brokers before opening an account, it may help to browse the Technical Analysis section for strategy education and the Broker Reviews hub for platform-specific due diligence.
Pros and Cons
Strengths
- Fibonacci retracement gives traders a structured way to map pullbacks instead of guessing where price may react.
- It can work across forex, stocks, indices, commodities, and crypto, which makes it flexible for multi-asset traders.
- The tool is available on many regulated platforms covered by Business24-7, including MT4, MT5, cTrader, TradingView, xStation 5, and TWS.
- It pairs well with support and resistance, candlestick confirmation, and trend analysis rather than requiring a fully standalone system.
- It may improve trade planning by helping define entries, invalidation areas, and target zones more clearly.
Considerations
- Fibonacci levels are not predictive on their own and may fail often in choppy or news-driven conditions.
- Different traders can draw different swing points, which makes the tool somewhat subjective.
- Many traders treat levels as exact prices, but in reality they often behave more like broad zones.
- Good charting tools do not remove platform risk, fee considerations, or the need to verify regulation with bodies such as the DFSA, SCA, FCA, or ASIC.
Common Mistakes to Avoid
The first mistake is drawing fibonacci retracement on weak or unclear swings. If the move is not obvious, the levels may not mean much. Start with cleaner price structure and avoid forcing the tool onto every chart.
The second mistake is treating one level as guaranteed support or resistance. A 61.8% retracement can fail just as easily as a 38.2% retracement if the underlying trend is breaking down.
The third mistake is ignoring costs and execution. A strategy that looks neat on a screenshot may perform very differently once spreads, commissions, slippage, and overnight charges are involved. This is especially relevant in leveraged CFD and forex trading where capital is at risk.
The fourth mistake is choosing a broker based only on marketing. If technical tools matter to you, compare platform depth, chart responsiveness, and regulatory standing. For broader platform education, you can also browse Business24-7’s Trading Fundamentals resources before making a final shortlist.
Frequently Asked Questions
What is fibonacci retracement used for in trading?
Fibonacci retracement is used to identify pullback areas where price may pause, reverse, or continue within a broader trend. Traders often use it to map possible support and resistance zones, plan entries, and estimate where risk may become easier to define. It is usually more effective when combined with other tools rather than used alone.
Which fibonacci retracement level is most important?
The 61.8% level is often treated as the most important because it is linked to the golden ratio. Still, many traders also watch 38.2%, 50%, and 78.6%. No single level is always superior. The quality of the trend, nearby structure, and confirmation signals usually matter more than the ratio by itself.
Does fibonacci retracement work in forex?
It can be useful in forex, especially in trending currency pairs where pullbacks are relatively clean. That said, fibonacci retracement forex setups may become less reliable during major economic releases or periods of erratic volatility. Traders should account for spreads, execution quality, and the risk that price may ignore a level entirely.
What is the difference between fibonacci retracement and fibonacci extension?
Fibonacci retracement measures how far price has pulled back within a move, while fibonacci extension projects where price might travel if the trend continues beyond the prior swing. Retracement is often used for entries and pullback analysis. Extension is more commonly used for target planning. Both should be treated as reference zones, not guarantees.
What are the best fibonacci settings?
For most traders, the default levels of 23.6%, 38.2%, 50%, 61.8%, and 78.6% are enough. The best fibonacci settings are usually the simplest ones. Adding too many custom ratios can clutter the chart and reduce clarity. A clean chart with meaningful swing selection tends to be more helpful than a highly customized setup.
How does fibonacci retracement work?
Fibonacci retracement works by measuring the distance between two swing points, typically a swing low and swing high in an uptrend, then plotting percentage pullback levels within that move. For example, if price rises from 1.2000 to 1.2500, the tool plots potential retracement zones such as 38.2%, 50%, and 61.8% of that move below the high. Traders then watch how price behaves around those zones and often look for confirmation from structure or candlestick reaction rather than assuming the level will hold.
What is 0.618 in trading?
0.618 is the decimal form of 61.8%, one of the most watched fibonacci ratios in trading. It is commonly called the golden ratio in market discussions because it is closely related to 1.618, a ratio that appears repeatedly when you divide numbers in the Fibonacci sequence. In practice, 0.618 is best treated as a widely observed reference zone, not a guaranteed turning point.
What are the 7 fibonacci levels?
The phrase “7 fibonacci levels” often refers to the five common retracement levels plus the two anchors of the measured move. Many traders count 0%, 23.6%, 38.2%, 50%, 61.8%, 78.6%, and 100%. Some charting tools or traders use slightly different sets by adding levels like 88.6% or focusing more on extension ratios such as 127.2% and 161.8% for target projections.
Why is 61.8 a golden ratio?
61.8% is called the golden ratio because it corresponds to 0.618, the inverse of approximately 1.618. As the Fibonacci sequence progresses, dividing a number by the next number tends to approach 0.618, while dividing a number by the previous number tends to approach 1.618. Traders adopted 61.8% as a key reference because it is widely watched, but it is still a framework for potential market behavior rather than a rule that price must respect.
Can beginners use fibonacci retracement?
Yes, but beginners should first learn trend structure and basic support and resistance. Without that foundation, fibonacci levels may feel random. The tool is easy to plot, yet harder to interpret correctly. It is usually safer for newer traders to treat it as a supporting framework rather than the sole basis for a trading decision.
Is fibonacci retracement enough to choose a trade?
No. A retracement level by itself is rarely enough. Most cautious traders look for confluence, such as prior structure, candlestick rejection, volume context, or trend continuation evidence. They also consider costs, leverage, and platform quality. Trading decisions based on one line alone may expose you to unnecessary risk.
Which platforms are useful for fibonacci analysis in the UAE?
Several regulated brokers covered by Business24-7 support charting tools relevant to fibonacci traders. Examples include Pepperstone on MT4, MT5, cTrader, and TradingView; XTB on xStation 5; Capital.com on web and MT4; Interactive Brokers on TWS; and AvaTrade on MT4 and MT5. Suitability depends on your experience, costs, and regulatory preferences.
Should UAE traders check regulation before relying on chart tools?
Yes. Good charting does not compensate for weak oversight. UAE-based traders may prefer firms regulated by bodies such as the DFSA, SCA, or ADGM FSRA, depending on the broker’s structure and regional presence. International regulators like the FCA, ASIC, and CySEC may also matter. Regulation does not remove risk, but it can improve accountability.
Key Takeaways
- Fibonacci retracement helps map pullback zones, but it is a planning tool rather than a prediction tool.
- The most watched levels are 38.2%, 50%, and 61.8%, with 61.8% commonly seen as the key golden ratio trading level.
- Best results usually come from combining fibonacci levels with support and resistance, trend structure, and price action confirmation.
- Platform choice still matters. Charting quality, fees, and regulation should all be reviewed before you trade real money.
- Business24-7 can help you compare regulated brokers and platform features before you make a decision.
Conclusion
Fibonacci retracement remains popular because it gives traders a simple framework for reading pullbacks and spotting areas of interest on a chart. Its value is practical, not magical. Used carefully, it may help you organize entries, exits, and risk. Used carelessly, it can become just another set of lines that encourages overconfidence. For UAE-based readers, the smarter approach is to combine technical tools with broker due diligence, fee awareness, and regulatory checks. Business24-7 aims to support that process with clear, impartial education and platform reviews shaped by Braden Chase’s background as a former research specialist at Forex.com. Before opening an account, explore our broker resources, compare regulated options side by side, and use our educational content as a reference point for safer decision-making.
Disclaimer: The content published on Business24-7 is intended for informational purposes only and does not constitute financial advice, investment recommendations, or an endorsement of any specific platform or financial product. Trading and investing carry significant risk, including the potential loss of capital. You should conduct your own research and, where appropriate, seek independent financial advice before making any investment decisions. Business24-7 does not accept responsibility for any financial losses incurred as a result of information published on this site.
Disclaimer
eToro is a multi-asset platform which offers both investing in stocks and cryptoassets, as well as trading CFDs.
Please note that CFDs are complex instruments and come with a high risk of losing money rapidly due to leverage. 61% of retail investor accounts lose money when trading CFDs with this provider. You should consider whether you understand how CFDs work, and whether you can afford to take the high risk of losing your money
This communication is intended for information and educational purposes only and should not be considered investment advice or investment recommendation. Past performance is not an indication of future results.
Copy Trading does not amount to investment advice. The value of your investments may go up or down. Your capital is at risk.
Crypto assets are complex and carry a high risk of volatility and loss. Trading or investing in crypto assets may not be suitable for all investors. Take 2 mins to learn more
eToro USA LLC does not offer CFDs and makes no representation and assumes no liability as to the accuracy or completeness of the content of this publication, which has been prepared by our partner utilizing publicly available non-entity specific information about eToro.
Fibonacci retracement is one of the most widely used chart tools for spotting pullback levels, possible trend continuation zones, and price areas where buyers or sellers may return. For traders in the UAE and wider MENA region, it can be useful because it adds structure to fast-moving markets without requiring overly complex indicators. Still, it works best as a decision-support…