
Support and resistance is one of the first chart-reading skills many traders learn, but it is also one of the most misunderstood. For UAE-based traders comparing strategies, platforms, and market approaches, these levels may help bring more structure to entries, exits, and risk control. Instead of treating the market as random movement, support and resistance gives you a framework for spotting where price has previously stalled, reversed, or accelerated. In this guide, we explain how to identify these levels, how to draw them with more consistency, and how traders may use them in real conditions. If you want a broader foundation first, our technical analysis guide is a useful starting point before applying support and resistance to live charts.
What support and resistance means
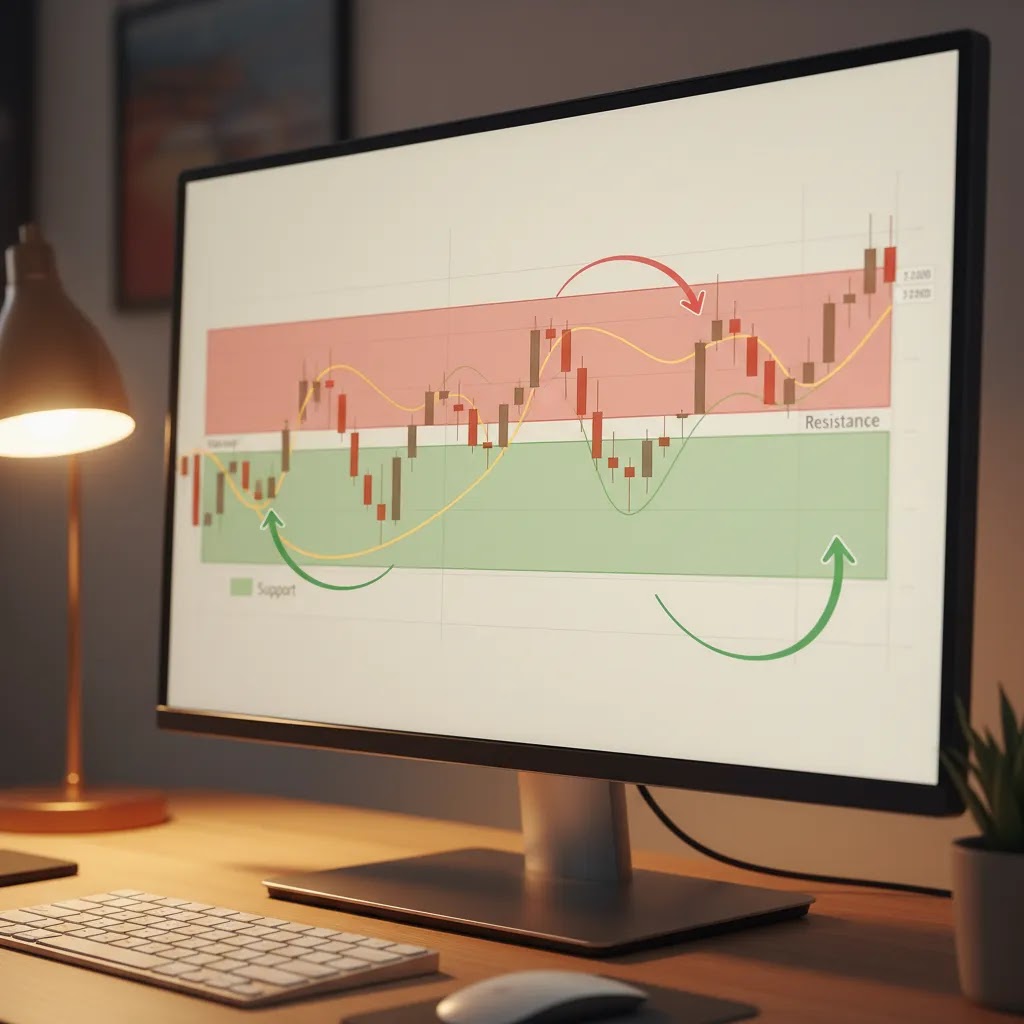
Support is a price area where demand may be strong enough to slow or pause a decline. Resistance is a price area where selling pressure may be strong enough to slow or pause an advance. In simple terms, support sits below current price and resistance sits above it.
These levels matter because markets often react around visible areas where traders previously bought, sold, took profit, or managed risk. The more often price responds to a level, the more attention traders tend to give it. That does not make the level permanent or certain. It only means the area may carry more decision-making weight than a random part of the chart.
Support and resistance levels are especially useful when combined with context. A level on its own may not tell you whether price will reverse or break through. You usually need to consider trend direction, volume where available, volatility, and candle behavior. Traders who already study price action trading often use support and resistance as the framework around which patterns and entries are built.
In most cases, it is better to think in terms of areas rather than exact lines. Markets rarely reverse at a perfect single price. They often test a range, reject it, break it, then retest it.
Do support and resistance levels actually work? What they represent in the market
Support and resistance can “work” in the sense that price often reacts around them, but it helps to understand what the level represents. In many markets, the most visible levels become decision points where orders cluster. Traders may place take-profit orders near prior highs, set stop-losses just beyond recent lows, or wait with limit orders at a well-known area. That mix of interest can create liquidity, which is one reason price may slow down, reject, or accelerate around the zone.
Think of it this way: a clean swing high or swing low is a place where the market previously made a clear choice. Buyers or sellers were strong enough to push price away. When price returns later, some participants remember the area, some have positions to manage there, and some are waiting to act because the level is “obvious.” None of that guarantees a repeat reaction, but it does explain why the market often responds more around these zones than in the middle of a random range.
The reality is that support and resistance is probabilistic. Levels can fail, especially in strong trends, during major news events, or when volatility expands suddenly. This is why experienced traders often treat levels as zones rather than single “magic lines,” and why confirmation matters. A level is usually more meaningful when it shows clear structure on higher timeframes, when the surrounding price action is clean, and when there is confluence. Confluence could be a prior breakout area, an obvious trend line, or overlap with Fibonacci levels, but it still requires risk control because price can move through any level at any time.
How to draw support and resistance
If you are learning how to draw support and resistance, start with a clean chart. Remove nonessential indicators so you can focus on structure first. Then follow a simple process:
- Choose a higher timeframe such as the 4-hour, daily, or weekly chart.
- Mark obvious swing highs and swing lows where price clearly reversed.
- Look for areas with multiple touches or repeated reactions.
- Extend those levels horizontally across the chart.
- Refine the line into a zone if price reacts across a wider band.
Higher timeframes often carry more weight than lower ones because more market participants may be reacting to them. A daily support level may matter more than a five-minute bounce, though intraday traders still use lower timeframe levels for timing.
One practical approach is to draw the most obvious levels first and ignore minor noise. If every small pause becomes a line, your chart becomes cluttered and decision-making usually gets worse. Many traders limit themselves to the nearest key levels above and below current price.
It also helps to check whether the level aligns with other structure. For example, if resistance matches a prior breakout point or a recognizable formation from chart patterns, that confluence may make the area more relevant. Even then, confirmation is still important because no level guarantees a reversal.
Static, dynamic, and zone-based levels
Not all support resistance zones work the same way. Broadly, traders tend to use three approaches.
Static support and resistance
Static levels are horizontal price areas based on previous highs, lows, and congestion zones. These are the most common and usually the easiest for beginners to spot. If EUR/USD repeatedly turns lower near the same prior high, that area may act as resistance. If gold keeps bouncing from a known floor, that may act as support.
Dynamic support resistance
Dynamic support resistance moves over time. Trend lines, moving averages, and channels are common examples. In an uptrend, a rising moving average may act as support. In a downtrend, a falling trend line may act as resistance. These levels shift as new candles form, which means they may be less intuitive for beginners but useful in trending markets.
Fibonacci support resistance
Some traders use retracement tools to estimate where pullbacks may pause. Popular Fibonacci levels such as 38.2%, 50%, and 61.8% are often treated as potential support or resistance zones, especially when they overlap with prior structure. If you want to understand that approach in more detail, our guide to fibonacci explains how retracement levels may fit into chart analysis.
For most traders, horizontal levels are the starting point. Dynamic tools and Fibonacci work better as confirmation layers rather than replacements for structure.
Advanced level mapping: swing structure, round numbers, and multi-timeframe zones
Once you understand the basics, the next step is mapping levels in a way that reflects how price actually moves. The goal is not to add more lines. It is to build a clear hierarchy of the most actionable areas so you are not reacting to every minor fluctuation.
Use swing structure to find the levels that matter most
From a practical standpoint, major swing highs and lows usually matter more than smaller intraday turns. A simple way to filter is to focus on the points that created a meaningful move, not a minor pause. If price reversed and ran far, or if it broke a prior structure level and continued, that area often becomes a reference point later.
Consolidation ranges are another key source of levels. When price moves sideways, it often builds a clear top and bottom. When the range eventually breaks, the former boundary may become a future retest area. This is closely related to role reversal, but the focus is on the broader zone created by multiple candles, not the exact high or low of one wick.
Pay attention to “flip zones” across timeframes
Flip zones are role reversal areas where a prior resistance region later behaves like support, or vice versa. What many people overlook is that these zones often look cleaner on a higher timeframe. A messy cluster of candles on a 15-minute chart might be a very clear support resistance zone on the 4-hour or daily chart. Marking the zone on the higher timeframe first, then using a lower timeframe for timing, may help keep your analysis consistent.
Round numbers and psychological levels often act like magnets
Round numbers are not technical levels in the classic swing-high sense, but they often attract attention because they are easy reference points. In forex, this can be the big figures and half figures, such as 1.1000 or 1.1050. In indices and commodities, it can be similarly obvious numbers. These areas are often treated as zones because price may overshoot briefly, then react. If a round number aligns with a prior swing level or a breakout point, the combined area can become more relevant than either reference on its own.
How to avoid clutter with a level hierarchy
If you want cleaner charts, assign your levels a simple priority. Keep major levels that are obvious on the daily or weekly chart. Add intermediate levels from the 4-hour chart that price is likely to interact with soon. Treat minor levels from lower timeframes as execution aids, not the foundation of your bias. This approach helps you avoid overfitting your analysis to recent noise, which is one of the fastest ways to lose trust in support and resistance.

How traders use support and resistance
Support and resistance trading usually falls into two broad ideas: trading the bounce or trading the break.
Trading a bounce
In this setup, a trader expects the level to hold. For example, if price approaches a well-tested support zone and forms a rejection candle, some traders may look for a long entry with a stop-loss below the zone. At resistance, the same logic may apply in reverse.
This method often works best when the level is clear, the market is not overly volatile, and there is evidence of rejection rather than blind guessing. Many beginners make the mistake of entering before price shows any reaction at all.
Trading a breakout
Here, the trader expects price to move through the level and continue. This may happen when momentum is strong or when a market has tested the same barrier several times. Some traders enter on the initial break, while others wait for a retest of the broken level. Our article on breakout trading covers this in more depth.
A common concept is role reversal. When resistance breaks, it may become support on a retest. When support breaks, it may become resistance. This does not always happen cleanly, but it is one of the more useful ways to think about key levels.
Risk management matters more than the pattern itself. Even strong levels can fail after news events, sudden volatility, or changes in sentiment. Capital is at risk, and past price reactions do not guarantee future outcomes.
How to confirm a support or resistance level before trading it
Support and resistance becomes much easier to use when you separate “a level on the chart” from “a level worth trading right now.” Confirmation does not eliminate risk, but it may reduce the number of trades taken from weak or unproven areas. Here are some practical ways traders often confirm levels before committing to a bounce or a breakout setup.
Look for multiple touches, but pay attention to the quality of the reaction
Multiple touches matter because they show repeated interest. Still, not every touch is equal. A strong reaction is usually one where price rejects the zone quickly and moves away with intent. If price drifts through the area with small candles and constant overlap, the “level” may be more like chop than a meaningful boundary.
Watch for rejection candles and whether price closes beyond the level
Rejection candles can be a practical form of confirmation, especially around bounce setups. A long wick into support that closes back above the zone may suggest buyers defended the area. At resistance, a wick above the level that closes back below may suggest sellers absorbed the push higher.
For breakouts, many traders look less at the wick and more at the close. A brief spike through resistance that closes back below it is often treated differently than a candle that closes clearly above the zone. Closes do not guarantee follow-through, but they can help you avoid treating every momentary wick as a true breakout.
Consider momentum and volatility context
The reality is that the same level can behave differently depending on market conditions. In a strong trend with expanding candles, support may not hold on the first test, and resistance may break more easily. In quieter conditions, levels may contain price more often. This is why many traders pair levels with basic price action context, such as whether candles are getting larger, whether pullbacks are shallow or deep, and whether the market is compressing into the level or bouncing away cleanly.
A simple decision process to avoid blind entries
If you want a repeatable approach, use a three-step process. First, identify the zone on a higher timeframe, such as the 4-hour or daily chart. Second, wait for price to reach the area and show a reaction, such as rejection, a clear close beyond the zone, or a clean retest. Third, decide whether the setup fits a bounce, a breakout, or no trade at all. Skipping the “reaction” step is where many traders get caught. They enter because price is near a line, not because the market has confirmed anything.
How false breaks often form, and what to look for
False breaks, sometimes called fakeouts, commonly appear as a wick through the level followed by a close back inside the prior range. After that, price may reverse in the opposite direction, especially if the move through the level was quick and immediately rejected. These situations can trap breakout traders who entered on the first push and can also punish bounce traders who placed stops too close to the level.
Confirmation cannot prevent every fakeout, but it can help you frame the risk. If you see a break without a supportive close, or you see price surge through a level and then stall, that may be a sign to reduce size, demand stronger evidence, or stand aside. Trading always involves uncertainty, so the goal is not to be right on every trade. It is to make your decisions based on consistent signals and controlled downside.
Common mistakes to avoid
- Drawing too many lines and treating every minor swing as important.
- Using exact prices instead of realistic support resistance zones.
- Ignoring the higher timeframe trend.
- Entering before any confirmation candle, rejection, or break.
- Forgetting that levels weaken after repeated tests in some market conditions.
- Placing stop-losses too tightly inside normal market noise.
- Assuming a support and resistance indicator can replace chart reading.
Indicators may help highlight recent highs, lows, pivots, or moving averages, but they are usually not a substitute for understanding market structure. If your chart tool marks dozens of automatic levels, you still need to judge which ones are meaningful.
Another common mistake is forcing relevance into headlines such as “xauusd support and resistance today” without considering timeframe. A gold level on a 15-minute chart may matter for a short-term trade but be insignificant on the daily chart. Context changes everything.

Platforms and tools that can help you apply support and resistance
Support and resistance is a chart skill, but your trading platform may affect how easy it is to apply. Good charting, fast execution, and clear pricing all matter if you plan to test level-based setups.
Pepperstone stands out for traders who want advanced charting through MT4, MT5, cTrader, and TradingView, with spreads from 0.0 pips on Razor and a $7/lot commission. It is regulated by the DFSA, FCA, ASIC, CySEC, and BaFin, and it offers copy trading plus no minimum deposit. That may suit active traders, though commission-based pricing and CFD risk will not suit everyone.
XTB may appeal to learners who want an accessible platform. It offers xStation 5, a $0 minimum deposit, spreads from 0.1 pips, and extensive education. It is regulated by the DFSA, FCA, CySEC, and KNF. Its educational focus may help traders practicing level drawing, though CFD products still carry material risk.
Capital.com offers a low $20 minimum deposit, spreads from 0.6 pips, TradingView integration, and SCA regulation in the UAE alongside FCA, CySEC, and ASIC oversight. For UAE-based readers concerned about local regulation, that may be relevant. Still, low entry cost should not be confused with low risk.
At Business24-7, we encourage readers to use educational frameworks before choosing a broker. That means checking regulation, platform quality, pricing, and the kind of assets you plan to trade. If you are still comparing options, browse our Technical Analysis resources for strategy education and our Trading Fundamentals section for the basics that support safer decision-making.
Pros and Cons
Strengths
- Support and resistance is simple enough for beginners to understand and useful enough for experienced traders to keep using.
- It may help structure entries, exits, and stop-loss placement with more discipline.
- It works across forex, stocks, indices, commodities, and crypto, though volatility differs by market.
- It combines well with other methods such as candlestick analysis, trend analysis, Fibonacci retracements, and breakout setups.
- It encourages traders to focus on key levels instead of reacting to every candle.
- It may improve trade selection by helping you avoid entering in the middle of random price ranges.
Considerations
- Levels are often subjective, so two traders may draw slightly different zones on the same chart.
- Support and resistance does not predict direction with certainty and may fail during strong momentum or news events.
- Beginners often overdraw levels, making charts crowded and hard to use.
- Automatic indicators can create false confidence if traders do not understand underlying price structure.
- Short-term levels may be unreliable without higher timeframe context.
How to evaluate a platform if you plan to trade key levels
If support and resistance is part of your strategy, the broker or platform you use may shape your execution quality and overall trading experience. A few criteria deserve extra attention.
1. Regulation and local relevance
For UAE-based traders, regulation should come first. Oversight from authorities such as the DFSA or SCA may provide a stronger framework than using a provider with unclear status. International regulators such as the FCA, ASIC, and CySEC may also matter, depending on the entity you open with. Always confirm which branch actually holds your account.
2. Spreads, commissions, and total cost
Level-based traders often place multiple trades around retests, breakouts, and false breaks. That means trading cost matters. Spread-only pricing may look simpler, while raw spread accounts with commission may be better for some active traders. Compare the full cost, not just the headline spread.
3. Charting and order tools
You need a platform that makes it easy to mark zones, switch timeframes, and place alerts. Tools like MT4, MT5, cTrader, TradingView, and proprietary platforms each have strengths. The right choice depends on whether you prefer simplicity or deeper customization.
4. Asset range
Support and resistance can be used in many markets, but your broker still needs to offer the instruments you want. Some traders focus on forex pairs, while others want gold, indices, stocks, or ETFs. Make sure the available asset list matches your plan.
5. Education and risk controls
Beginners may benefit from brokers that offer education, demo access, and practical risk controls. That is one reason platforms such as XTB, AvaTrade, and Capital.com are often considered by newer traders, based on their education features, platform accessibility, and UAE-relevant regulation noted in available data. Educational support does not remove risk, but it may help you practice more carefully.
Frequently Asked Questions
What is support and resistance in trading?
Support and resistance refers to price areas where markets have previously paused, reversed, or accelerated. Support sits below current price and may act as a floor, while resistance sits above current price and may act as a ceiling. These areas are not guaranteed turning points, but they may help traders organize chart analysis and risk planning.
How do I identify support resistance levels correctly?
Start with higher timeframes and mark obvious swing highs, swing lows, and repeated reaction areas. Focus on places where price changed direction multiple times. In most cases, zones work better than exact lines because markets rarely reverse at a perfect single price. Clarity matters more than quantity.
Is support and resistance useful for beginners?
Yes, many beginners find it useful because it gives structure to the chart without needing many indicators. It may help with entries, stop placement, and trade planning. The challenge is consistency. New traders often draw too many levels or trust them too much without waiting for confirmation.
What is dynamic support resistance?
Dynamic support resistance changes over time instead of staying fixed horizontally. Examples include moving averages, trend lines, and channels. These tools may be helpful in trending markets, but they can also be more subjective than horizontal levels. Many traders use them as confirmation rather than the main decision tool.
Can I use a support and resistance indicator instead of drawing levels manually?
Indicators may save time by highlighting pivots, highs, lows, or moving averages, but they do not remove the need for judgment. Automated tools can mark too many levels or emphasize weak ones. Manual chart reading usually helps traders understand which areas are genuinely important and which are just noise.
Does support and resistance work on gold and XAU/USD?
Yes, traders commonly use support and resistance on gold, including XAU/USD. Gold can react well to visible structure, but it may also move sharply during geopolitical events, central bank communication, or U.S. dollar moves. That means levels may break faster than expected, so position sizing and stop placement matter.
Which timeframe is best for support and resistance trading?
There is no single best timeframe. Daily and 4-hour charts often provide stronger key levels, while lower timeframes may help refine entries. Many traders mark major levels on the higher timeframe and then use a lower timeframe for execution. The best choice depends on your strategy, holding period, and risk tolerance.
How is Fibonacci support resistance different from standard levels?
Standard support and resistance usually comes from visible price history such as prior highs, lows, and ranges. Fibonacci support resistance uses retracement percentages to estimate where pullbacks may react. Some traders combine both methods, especially when a Fibonacci level overlaps with a known horizontal zone.
Can support and resistance guarantee profitable trades?
No. Support and resistance may improve structure and planning, but it cannot guarantee outcomes. Markets can break levels, fake out traders, or ignore technical setups during volatile conditions. Trading always involves risk, and capital is at risk regardless of how clear a chart setup may appear.
What is the meaning of support and resistance?
The meaning of support and resistance is straightforward: they are price areas where buying or selling pressure may become strong enough to change the pace of the move. Support is the zone where declines may stall because demand increases, while resistance is the zone where rallies may stall because supply increases. They are not fixed rules. They are a way to describe where the market has repeatedly made decisions in the past.
How do you confirm support and resistance?
Confirmation often comes from how price behaves when it reaches the zone. Traders commonly look for multiple prior reactions, clear rejection candles, and whether price closes back inside the level or closes cleanly beyond it. Many also consider context such as trend strength and volatility. Confirmation can reduce, but not remove, the risk of being caught in a false break or a weak bounce.
Do support and resistance really work?
They can work as a framework because markets often react around visible decision points where orders and attention cluster. Still, they are not reliable in every condition, and they do not work with certainty. Levels can fail during strong momentum, news-driven volatility, or when the market is repricing quickly. Many traders find they are most useful when treated as zones and combined with confirmation and disciplined risk management.
What is the 3 6 9 rule in trading?
The “3 6 9 rule” does not have one universal definition in trading, and you may see it used in different ways depending on the strategy or community. Some traders use it as a simple discipline framework, for example limiting the number of active levels on a chart, scaling in or out in steps, or using structured review intervals. If you come across a 3 6 9 rule, the key is to verify what it means in that specific context and whether it fits your risk controls, because it is not a standardized market principle like support and resistance itself.
Key Takeaways
- Support and resistance levels are best treated as zones, not perfect prices.
- Higher timeframe levels often carry more weight than short-term chart noise.
- Traders usually approach these areas through bounce setups, breakouts, or retests.
- Dynamic support resistance and Fibonacci tools may help, but structure should come first.
- Platform quality, regulation, charting tools, and trading costs all matter if you plan to trade key levels actively.
Conclusion
Support and resistance remains one of the most practical ways to read market structure, especially for traders who want a clearer framework for entries, exits, and risk control. The key is not drawing more lines. It is learning which levels matter, waiting for confirmation, and understanding that no chart area is certain to hold. For UAE-based readers, that same disciplined mindset should also apply when choosing a broker or platform. Regulation, fees, charting quality, and educational support all deserve careful review. If you are building your strategy and comparing providers at the same time, Business24-7 is designed to help you make that process more informed. Explore our platform reviews, comparison resources, and technical analysis guides before making a trading decision.
Disclaimer: The content published on Business24-7 is intended for informational purposes only and does not constitute financial advice, investment recommendations, or an endorsement of any specific platform or financial product. Trading and investing carry significant risk, including the potential loss of capital. You should conduct your own research and, where appropriate, seek independent financial advice before making any investment decisions. Business24-7 does not accept responsibility for any financial losses incurred as a result of information published on this site.
Disclaimer
eToro is a multi-asset platform which offers both investing in stocks and cryptoassets, as well as trading CFDs.
Please note that CFDs are complex instruments and come with a high risk of losing money rapidly due to leverage. 61% of retail investor accounts lose money when trading CFDs with this provider. You should consider whether you understand how CFDs work, and whether you can afford to take the high risk of losing your money
This communication is intended for information and educational purposes only and should not be considered investment advice or investment recommendation. Past performance is not an indication of future results.
Copy Trading does not amount to investment advice. The value of your investments may go up or down. Your capital is at risk.
Crypto assets are complex and carry a high risk of volatility and loss. Trading or investing in crypto assets may not be suitable for all investors. Take 2 mins to learn more
eToro USA LLC does not offer CFDs and makes no representation and assumes no liability as to the accuracy or completeness of the content of this publication, which has been prepared by our partner utilizing publicly available non-entity specific information about eToro.
Support and resistance is one of the first chart-reading skills many traders learn, but it is also one of the most misunderstood. For UAE-based traders comparing strategies, platforms, and market approaches, these levels may help bring more structure to entries, exits, and risk control. Instead of treating the market as random movement, support and resistance gives you a framework for…