
If you trade forex, stocks, commodities, or indices, one of the hardest questions is not where price might go next, but whether the market is actually trending strongly enough to justify a trend-following setup. That is where the adx indicator, also called the average directional index, can help. It is widely used to estimate trend strength rather than direction, which makes it useful for filtering weak breakouts and noisy ranges. For readers building a broader framework, our technical analysis guide gives helpful context on where ADX fits among other chart tools. For UAE-based traders comparing indicators, platforms, and broker tools, understanding ADX may reduce avoidable mistakes, though it should never be treated as a guarantee of profitable trades. Capital is always at risk.
What the ADX indicator measures
The average directional index is a technical indicator designed to measure the strength of a trend. It does not tell you whether the trend is bullish or bearish on its own. Instead, it focuses on whether price is moving with enough force to suggest a meaningful trend is in place.
This distinction matters. Many newer traders assume a rising ADX means price is going up. In reality, a rising ADX may simply mean the current move, up or down, is becoming stronger. A falling ADX may suggest the trend is weakening, consolidating, or losing momentum.
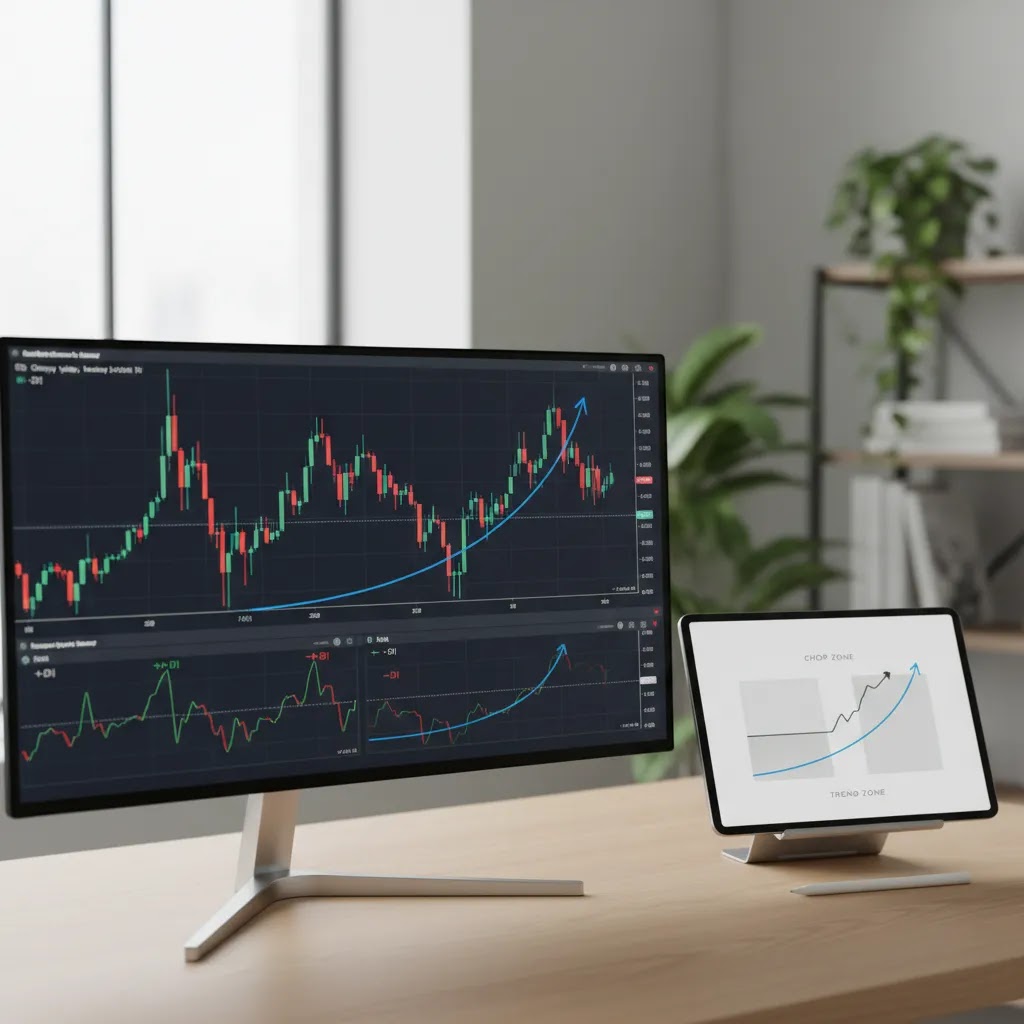
ADX is part of the Directional Movement Index system, often called adx dmi. It is usually displayed with three lines: the ADX line itself, the positive directional indicator (+DI), and the negative directional indicator (-DI). Together, these can help you judge both trend strength and possible directional bias.
If you are comparing it with other momentum and direction tools, our guide to forex indicators may help you see where ADX is most useful and where it may be less reliable.
ADX, +DI, and -DI explained
To use the ADX indicator properly, you need to separate its parts.
- ADX line: Measures trend strength only.
- +DI line: Measures positive directional movement and may suggest bullish pressure.
- -DI line: Measures negative directional movement and may suggest bearish pressure.
In simple terms, if +DI is above -DI, buyers may have more control. If -DI is above +DI, sellers may have more control. The ADX line then tells you whether that directional edge appears weak or strong.
For example, if +DI crosses above -DI and ADX is rising from a low level, some traders interpret that as a strengthening bullish trend. If -DI is above +DI and ADX climbs, that may point to a strengthening bearish trend. Still, these are not foolproof signals. False breakouts, thin liquidity, and news events can easily disrupt them.
That is why ADX is often paired with price action tools such as trend lines or trend filters such as moving averages. Used together, these tools may help you avoid taking every crossover at face value.

How to read ADX levels
Most traders use rough ADX thresholds rather than exact predictive rules. These levels are guidelines, not guarantees.
- ADX below 20: Often interpreted as a weak trend or a ranging market.
- ADX above 25: Often treated as a sign that trend strength is becoming meaningful.
- ADX above 40: May indicate a very strong trend, though late entries become riskier.
- ADX falling from high levels: May show trend exhaustion or slowing momentum.
The common phrases adx above 25 and adx below 20 appear often because they help traders quickly classify conditions. A market with ADX under 20 may suit range strategies better than breakout strategies. A market with ADX pushing above 25 may be more attractive for pullback or trend-following entries.
Context still matters. On lower time frames, ADX may react quickly and create more noise. On higher time frames, it may be slower but potentially more meaningful. Economic releases, central bank decisions, and volatility spikes in forex or commodity markets may also distort readings in the short term.
ADX vs RSI: trend strength vs oscillator signals
Many traders end up comparing ADX with RSI because both can feel like they describe “momentum,” but they answer different questions. ADX focuses on whether the market is trending strongly, while RSI is an oscillator that traders often use to gauge momentum and potential overbought or oversold conditions.
Think of it this way: ADX may help you decide whether a trend-following mindset makes sense at all. RSI may help you judge whether price has pushed too far too fast relative to its recent moves. Neither tool can tell you what will happen next, and both can give misleading signals in the wrong conditions.
From a practical standpoint, here is how beginners often separate their use cases:
- Range-heavy markets: Oscillator-based thinking tends to fit better. When price is moving sideways, RSI signals may appear more “readable” because swings often revert. ADX in those conditions is frequently low and may simply confirm that a trend approach is less appropriate.
- Trend-heavy markets: A trend-strength filter tends to fit better. In strong trends, RSI can stay elevated or depressed for long periods, which can tempt traders to fade a trend too early. ADX, on the other hand, may help you accept that a trend is strong even if pullbacks look sharp.
Some traders combine both: use ADX to confirm that trend conditions look present (for example, ADX rising and holding above a threshold), then use RSI behavior to time pullbacks rather than chasing breakouts. For instance, a trader may wait for RSI to cool off during a pullback while ADX remains supportive of trend strength. This approach can be logical, but it is not a guarantee of better results. Market regimes can shift quickly, and indicators can lag behind those shifts.
Best ADX settings and chart setup
The standard ADX setting is 14 periods, and that remains the default on most charting platforms. For many traders, that is a reasonable starting point because it balances responsiveness and smoothing.
That said, there is no universal answer to best adx settings. The right setup may depend on your market, time frame, and strategy style.
- ADX 14: Standard setting for general use.
- ADX 7 to 10: More responsive, but may create more false signals.
- ADX 20 or higher: Smoother and slower, often better for higher time frames.
If you are a short-term forex trader, you may prefer a faster setting to capture momentum changes earlier. If you swing trade stocks or indices, a slightly slower setting may help reduce noise. In most cases, traders should test adx settings across different market conditions before relying on them in live trading.
A practical chart setup could include price candles, the ADX with +DI and -DI, and one simple trend filter such as a moving average. Keeping the chart uncluttered usually makes decision-making easier, especially for less experienced traders.

How ADX is calculated (and why it lags)
Most traders will never need to hand-calculate the average directional index. Your platform does that for you. Here is the thing though: understanding what ADX is built from helps you interpret when the reading is meaningful and when it may be distorted by volatility spikes or choppy price action.
ADX comes from J. Welles Wilder’s Directional Movement system. Under the hood, the indicator is essentially asking two questions: which side is showing more directional movement, and how strong is that movement relative to recent volatility?
Directional Movement and True Range in plain English
The process starts with three building blocks:
- +DM (Positive Directional Movement): Measures how much today’s high moved above yesterday’s high, but only when that “up move” is bigger than the “down move.” If there is no meaningful up move, +DM is treated as zero.
- -DM (Negative Directional Movement): Measures how much today’s low moved below yesterday’s low, but only when that “down move” is bigger than the “up move.” If there is no meaningful down move, -DM is treated as zero.
- TR (True Range): A volatility measure that accounts for gaps. It uses the largest of: today’s high minus today’s low, today’s high minus yesterday’s close, or today’s low minus yesterday’s close.
Those values are then smoothed, typically using Wilder’s smoothing method over the lookback period (often 14). This smoothing is a big part of why ADX is considered lagging. It filters noise, but it also means it reacts after price has already moved.
How +DI, -DI, and ADX are derived
After smoothing, the indicator converts directional movement into two “directional indicators”:
- +DI: Smoothed +DM divided by smoothed TR, scaled to a percentage.
- -DI: Smoothed -DM divided by smoothed TR, scaled to a percentage.
Then it calculates a value often called DX, which compares the difference between +DI and -DI to their total. ADX is essentially a smoothed average of that DX value. The output is a trend-strength line that ignores whether the market is rising or falling, because strength can exist in both directions.
What traders actually need to remember
You do not need the formula memorized. What many people overlook is the practical takeaway: ADX is influenced by directional movement and volatility, then smoothed. In fast markets, a volatility surge can push TR higher, which may change DI behavior. In stop-start price action, the smoothing can keep ADX elevated even after conditions begin to change. This is why traders often treat ADX as confirmation, not prediction, and why entry timing usually needs help from price structure or a separate trigger.
How traders may use ADX in a strategy
An adx strategy is usually less about using ADX as a standalone trigger and more about using it as a filter. This may improve discipline by keeping you out of trades when trend conditions are weak.
A simple trend filter approach
- Identify direction using price structure, a moving average, or support and resistance.
- Check whether +DI or -DI supports that directional view.
- Confirm whether ADX is rising and preferably above 20 or 25.
- Wait for an entry signal, such as a pullback, breakout retest, or candle confirmation.
For example, in adx forex trading, if EUR/USD is above a rising moving average, +DI is above -DI, and ADX rises above 25, a trader might look for bullish pullbacks rather than chasing every breakout candle. If ADX remains below 20, the same trader may decide trend trades are lower quality.
Where ADX may struggle
ADX is a lagging indicator because it is based on past price data. By the time it confirms strong trend strength, part of the move may already be over. It may also give mixed signals during choppy sessions or around major news. That is why traders should combine it with structure, volatility awareness, and risk management.
No version of adx trading removes risk. Stops, position sizing, and realistic expectations still matter more than any single indicator reading.
Common ADX trade signals (and their limits)
Many traders focus on ADX thresholds, but there are a few “classic reads” that come up often in real trading. Consider this: ADX is most useful as a way to describe conditions, not as a mechanical buy or sell button. The same reading can lead to very different outcomes depending on where price is relative to support, resistance, and recent structure.
ADX rising vs falling
A rising ADX is commonly interpreted as trend strength building. It may happen in uptrends or downtrends. A falling ADX is commonly interpreted as trend strength fading, which may mean consolidation, a transition into range behavior, or simply a pause before trend continuation.
The limit is timing. Because ADX is smoothed, “ADX rising” can show up after a big expansion move. If you treat it as an entry trigger, you may end up buying or selling late. Many traders instead use rising ADX as permission to focus on trend-style entries such as pullbacks and break-and-retest patterns, rather than as a reason to chase price.
+DI and -DI crossovers with ADX confirmation
Another common signal is a +DI and -DI crossover. If +DI crosses above -DI, traders may read it as bullish pressure taking the lead. If -DI crosses above +DI, they may read it as bearish pressure taking the lead. When this crossover happens while ADX is rising from low levels, some traders treat it as extra confirmation that trend conditions could be improving.
Here is the caution: DI crossovers can be noisy in ranges. In sideways conditions, +DI and -DI may cross back and forth frequently, even though there is no durable trend. ADX can help filter some of that, but it will not eliminate false signals. In practice, traders often want to see the crossover align with a structural break, a higher high or lower low sequence, or a clean breakout from a range.
High ADX does not always mean “safe”
ADX can stay high even when price starts to reverse. That can happen because the smoothing keeps the trend-strength reading elevated after a strong move. The reality is that a strong trend can also be near exhaustion, especially after extended runs or news-driven spikes.
From a practical standpoint, many traders treat very high ADX as a reason to be more selective about entry location and risk. Late entries can face sharper pullbacks, wider intraday swings, and more slippage around volatile events. Confirmation from price structure, realistic stop placement, and position sizing still matter, regardless of how “strong” the indicator looks.
Platforms that offer ADX tools for UAE-based traders
The ADX indicator is available on many mainstream trading platforms, but the experience varies based on charting depth, interface quality, and the range of tools around it. If you are evaluating brokers as well as indicators, these Business24-7-reviewed platforms may be relevant examples.
| Platform | Starting Cost Info | Platforms | Regulation | Why it may appeal to indicator-based traders |
|---|---|---|---|---|
| Pepperstone | Spreads from 0.0 pips (Razor), $7/lot commission | MT4, MT5, cTrader, TradingView | DFSA, FCA, ASIC, CySEC, BaFin | Wide platform choice and advanced charting tools |
| AvaTrade | Spreads from 0.9 pips | MT4, MT5, AvaTradeGO, WebTrader | ADGM FSRA, CBI, ASIC, FSA Japan | Education focus and built-in risk management features |
| XTB | Spreads from 0.1 pips | xStation 5, Mobile App | DFSA, FCA, CySEC, KNF | Strong education and accessible platform design |
| Capital.com | Spreads from 0.6 pips | Capital.com Web, Mobile App, MT4 | SCA, FCA, CySEC, ASIC | Low $20 minimum deposit and mobile-friendly access |
For UAE readers, regulation should remain central. Depending on the broker, oversight may come from the DFSA, SCA, ADGM FSRA, FCA, ASIC, or CySEC. Regulation does not remove market risk, but it may improve protections around conduct, disclosures, and operational standards.
Business24-7 reviews platforms through a safety-first lens that reflects the site’s editorial mission and Braden Chase’s background as a former research specialist at Forex.com. If you want to compare more options before opening an account, browse the Trading Platforms and Brokers section or explore the wider Technical Analysis category for more indicator education.
Pros and Cons
Strengths
- The ADX indicator helps measure trend strength without forcing a directional opinion too early.
- It becomes more useful when combined with +DI and -DI, which may help traders assess bullish or bearish pressure.
- Standard ADX settings are available on widely used platforms such as MT4, MT5, cTrader, TradingView, xStation 5, and proprietary web platforms offered by brokers reviewed on Business24-7.
- It may help traders filter out weak setups and avoid applying trend strategies in clearly ranging conditions.
- It works across multiple asset classes, including forex, stocks, commodities, indices, and crypto CFDs.
Considerations
- ADX is lagging, so it may confirm strength only after part of the move has already happened.
- Readings such as ADX above 25 or below 20 are guidelines, not reliable stand-alone trade signals.
- In choppy or news-driven markets, ADX and DI crossovers may produce misleading signals.
- Using ADX alone, without price structure or risk controls, may lead to poor trade selection.
Frequently Asked Questions
What is the ADX indicator used for?
The ADX indicator is used to measure the strength of a price trend. It does not directly show whether price will move up or down. Instead, traders often use it to decide whether a market appears strong enough for trend-following strategies or weak enough that range-based approaches may be more suitable.
What does the ADX indicator tell you?
The ADX indicator tells you how strong a trend appears to be, based on recent directional movement and volatility. It is not a directional signal on its own. Traders often read ADX alongside +DI and -DI to understand whether bullish or bearish pressure seems more dominant, while remembering that indicators are derived from past price data and can lag.
What does ADX above 25 mean?
ADX above 25 is commonly interpreted as a sign that trend strength is becoming more meaningful. It does not guarantee continuation, and it does not tell you direction on its own. Traders usually pair this reading with +DI, -DI, price structure, or another filter before acting on it.
What does ADX below 20 mean?
ADX below 20 often suggests a weak trend or sideways market. In those conditions, breakout and trend-following trades may be less reliable. Some traders become more cautious when ADX stays low, though they should still confirm conditions with support, resistance, and broader chart context.
How do +DI and -DI work with ADX?
The +DI and -DI lines estimate directional pressure. If +DI is above -DI, bullish momentum may be stronger. If -DI is above +DI, bearish momentum may be stronger. ADX then helps assess whether that directional pressure is weak or strong. Together, they form the Directional Movement Index system.
What are the best ADX settings?
The standard setting is 14 periods, and that is the most common starting point. Shorter settings may react faster but could create more noise. Longer settings may be smoother but slower. The best choice typically depends on your market, trading style, and time frame rather than a universal rule.
Is ADX good for forex trading?
ADX may be useful for forex traders because currency pairs often alternate between trending and ranging phases. It can help identify whether conditions appear strong enough for trend setups. Still, forex markets react sharply to economic releases and central bank decisions, so ADX should be used with caution and sound risk control.
Can beginners use the ADX indicator?
Yes, beginners can use ADX, especially because its purpose is fairly simple once explained clearly. The main challenge is avoiding overconfidence in one indicator. Newer traders may benefit from using ADX as a supporting filter, not as a full strategy, while learning basic price action and risk management first.
Which is better, RSI or ADX?
Neither is universally better because they measure different things. ADX is designed to assess trend strength, while RSI is an oscillator often used to interpret momentum and potential overbought or oversold conditions. Many beginners find RSI more intuitive in ranges, while ADX can be more helpful as a filter in trending conditions. Both can fail in certain market regimes, so it helps to validate any signal with price structure and disciplined risk controls.
Is ADX a reliable indicator?
ADX can be reliable as a trend-strength filter in the sense that it often helps traders avoid forcing trend strategies in clearly weak conditions. It is still a lagging indicator built from past price data, so it may confirm strength late, stay elevated after conditions change, or give mixed readings in choppy markets. That is why many traders treat it as one input, not a stand-alone decision tool.
Which indicator works best with ADX?
ADX is often paired with tools that add structure and timing. Some traders combine it with moving averages or trend lines to define direction, then use price action confirmation for entries. Others add an oscillator such as RSI to help time pullbacks while ADX suggests trend conditions are still present. No combination guarantees performance, but pairing ADX with clear structure and risk management is usually more practical than using it alone.
Which brokers commonly offer ADX on their platforms?
Brokers reviewed by Business24-7 that provide platforms commonly associated with ADX access include Pepperstone through MT4, MT5, cTrader, and TradingView, AvaTrade through MT4 and MT5, XTB through xStation 5, and Capital.com through MT4 and its web platform. Platform access may vary by account and region.
Is ADX enough on its own to open trades?
In most cases, no. ADX is better used as a filter than as a stand-alone trigger. It may tell you whether a trend appears strong, but it will not define precise entries, stop placement, or risk. Many traders combine it with chart structure, moving averages, or support and resistance.
How should UAE traders think about ADX and platform safety?
ADX is only an analysis tool. Platform safety is a separate issue. UAE traders should look for brokers regulated by bodies such as the SCA, DFSA, or ADGM FSRA, or by established international regulators like the FCA, ASIC, or CySEC. Regulation may improve oversight, but trading losses can still occur.
Key Takeaways
- ADX measures trend strength, not direction.
- +DI and -DI help add directional context to ADX readings.
- ADX above 25 may suggest stronger trend conditions, while ADX below 20 may point to range-bound markets.
- The default 14-period setting is a sensible starting point, but traders often adjust it by time frame and style.
- ADX works best as part of a broader trading process that includes price action, risk management, and broker due diligence.
Conclusion
The ADX indicator remains one of the more practical tools for judging whether a market is trending strongly enough to support a trend-based idea. Its real value is not prediction, but filtering. If you use it with +DI, -DI, price structure, and disciplined risk management, it may help you avoid some low-quality setups. For UAE-based readers researching both indicators and broker platforms, Business24-7 aims to be a steady reference point, with educational content shaped by editorial independence and Braden Chase’s research background at Forex.com. Before choosing a platform for indicator-based trading, review our broker resources, compare regulation and fee structures carefully, and read full platform evaluations rather than relying on marketing claims alone.
Disclaimer: The content published on Business24-7 is intended for informational purposes only and does not constitute financial advice, investment recommendations, or an endorsement of any specific platform or financial product. Trading and investing carry significant risk, including the potential loss of capital. You should conduct your own research and, where appropriate, seek independent financial advice before making any investment decisions. Business24-7 does not accept responsibility for any financial losses incurred as a result of information published on this site.
Disclaimer
eToro is a multi-asset platform which offers both investing in stocks and cryptoassets, as well as trading CFDs.
Please note that CFDs are complex instruments and come with a high risk of losing money rapidly due to leverage. 61% of retail investor accounts lose money when trading CFDs with this provider. You should consider whether you understand how CFDs work, and whether you can afford to take the high risk of losing your money
This communication is intended for information and educational purposes only and should not be considered investment advice or investment recommendation. Past performance is not an indication of future results.
Copy Trading does not amount to investment advice. The value of your investments may go up or down. Your capital is at risk.
Crypto assets are complex and carry a high risk of volatility and loss. Trading or investing in crypto assets may not be suitable for all investors. Take 2 mins to learn more
eToro USA LLC does not offer CFDs and makes no representation and assumes no liability as to the accuracy or completeness of the content of this publication, which has been prepared by our partner utilizing publicly available non-entity specific information about eToro.
If you trade forex, stocks, commodities, or indices, one of the hardest questions is not where price might go next, but whether the market is actually trending strongly enough to justify a trend-following setup. That is where the adx indicator, also called the average directional index, can help. It is widely used to estimate trend strength rather than direction, which…