
Trend line trading is one of the simplest ways to read price structure, but it is also one of the easiest tools to misuse. Many traders draw lines that fit their bias instead of the market, which can lead to poor entries and weak risk control. If you are trading from the UAE and want a cleaner way to identify direction, support, resistance, and possible breakouts, trend lines can help when used properly. This article explains how to draw them, how to avoid the most common mistakes, and how they fit into a wider technical analysis guide. The goal is not to promise results. It is to help you build a more disciplined process for reading charts in forex, stocks, commodities, and indices.
What trend line trading really means
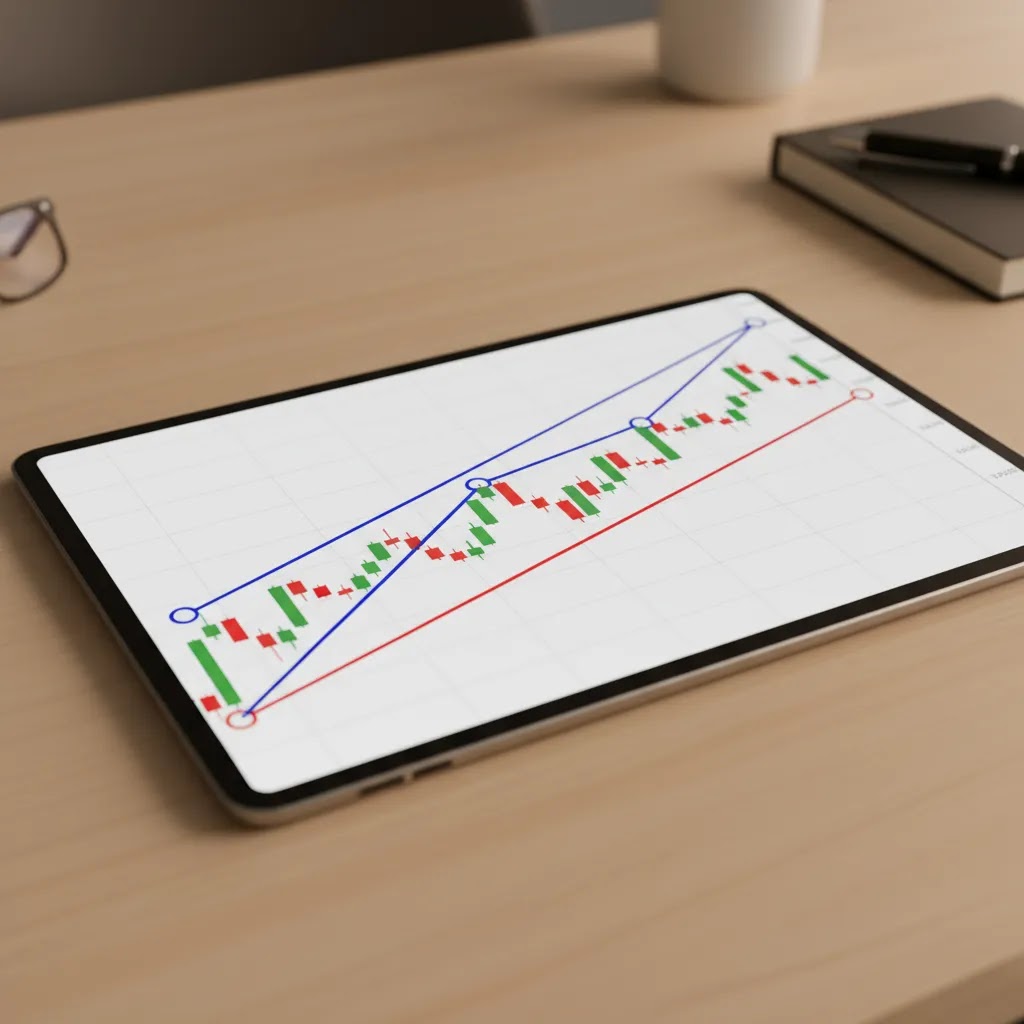
A trend line is a line drawn across price swing points to show the market’s direction. In an uptrend, traders usually connect a series of higher lows to create an uptrend line. In a downtrend, they connect lower highs to create a downtrend line. The line acts as a visual guide, not a fixed law of the market.
Trend line trading usually involves three main ideas. First, you use the line to identify the current market trend. Second, you watch how price behaves when it returns to that line. Third, you monitor whether price respects the line or breaks through it, which could suggest weakening momentum or a possible trend reversal.
This matters because many beginners try to trade every move they see. A trend line can help you stay focused on the bigger structure. It may also work well alongside support and resistance, since trend lines often act like diagonal support or resistance zones rather than exact levels.
Still, no line guarantees a winning trade. Markets can break a trend line and then reverse again, especially during volatile news events. Capital is at risk, and past price behavior does not guarantee future outcomes.
How to draw trend lines correctly
The quality of your trend line depends on consistency. If you keep changing the line to fit every candle, it loses value. In most cases, a useful trend line should connect at least two clear swing points, while three touches generally make the line more meaningful.
For an uptrend line
- Start with a visible series of higher lows.
- Connect the first two important swing lows.
- Extend the line forward to see whether price respects it again.
- Treat the line as an area, not an exact number.
For a downtrend line
- Look for a sequence of lower highs.
- Connect two clear swing highs.
- Extend the line into future price action.
- Watch for repeated rejection from that line.
One common mistake is forcing a line through minor candles while ignoring the broader structure. Another is drawing trend lines on time frames that are too small for your style. A five-minute chart may contain more noise than a four-hour chart, so the right time frame depends on whether you are scalping, day trading, or swing trading.
It also helps to understand where trend lines fit with chart patterns. Triangles, wedges, and channels are often built from the same basic principle: connecting repeated highs and lows to find structure. If your chart already shows a trend channel, a single line may not be enough. In that case, the channel gives a fuller view of momentum and possible reversal areas.
Best timeframes for trend line trading, and why they matter
Here’s the thing: the time frame you draw on changes what the trend line actually represents. On lower time frames, you usually get more “signal and noise” mixed together. On higher time frames, you often see cleaner swing points, which can make trend lines easier to draw consistently and easier to respect as structure.
If you are scalping, you might work with very short charts, but that often means your trend lines can be vulnerable to random spikes, spread widening, and fast liquidity shifts. Day traders typically benefit from trend lines drawn on a higher “anchor” time frame, then using a lower chart for entries. Swing traders often focus on 4H and Daily structure, where trend lines may reflect broader positioning rather than short-term fluctuation.
From a practical standpoint, one common workflow is multi-timeframe validation. You can draw the primary trend line on the 4H or Daily chart using obvious swing points, then switch to the 1H chart to watch how price behaves as it approaches that same area. If the higher-timeframe line aligns with a horizontal level, a prior swing point, or a clear trend structure, it often carries more weight than a line drawn only on a fast chart.
What many people overlook is the mismatch between time frame and expectations. Traders sometimes draw a trend line on a one-minute or five-minute chart and expect it to hold through a major data release or a sudden volatility surge. That is where trend lines get blamed, even though the issue is usually context. Trend lines are best treated as structure tools, and structure tends to be clearer on the time frame that matches your holding period and your risk tolerance.
How traders use trend lines in practice
There is no single trendline trading strategy that suits every market. Still, most traders use trend lines in one of three ways.
Bounce trades in a healthy trend
In a rising market, traders may wait for price to pull back toward an uptrend line and then look for bullish confirmation before entering. In a falling market, they may do the opposite at a downtrend line. Confirmation could come from candlestick behavior, confluence with horizontal support or resistance, or volume patterns where relevant.
Trend line breakout setups
A trend line breakout can suggest that the current trend is weakening. That does not always mean a full reversal is starting, but it may signal a change in structure. If you trade breakouts, it is worth studying breakout trading in more depth, because false breaks are common. Many experienced traders wait for a candle close beyond the line, or for a retest, rather than reacting to the first spike.
Trend confirmation, not entry timing
Some traders use trend lines mainly as a filter. For example, if price remains above a rising line and market structure still shows higher lows, they may favor long setups only. This can help reduce impulsive countertrend trades.
A practical trend line forex approach often combines diagonal structure with moving averages, horizontal zones, or momentum tools. The key is not to overload the chart. A few tools used consistently may be more useful than ten indicators giving mixed signals.
How to trade trend line breakouts: confirmation, retests, and false break filters
Trend line breakouts tend to attract beginners because they look obvious in hindsight. The reality is that many “breaks” are just temporary volatility, especially in fast markets or around high-impact news. A simple confirmation process can help you avoid reacting to the first move you see, though it cannot remove risk.
Consider this breakout checklist as a way to keep your decision-making consistent. First, look for a clear candle close beyond the trend line, not just a wick through it. Second, watch what price does next. In many cases, the market will retest the broken line from the other side. If the line was support and it breaks, the retest may act like resistance. If the line was resistance and it breaks, the retest may act like support. Third, define what would invalidate your idea. If price closes back inside the trend line area and holds there, that can be a warning sign that the breakout did not stick.
False breaks often happen for predictable reasons. One is a liquidity run, where price pushes through a level to trigger stops and then snaps back. Another is a news spike, where the first reaction is exaggerated and later retraces as the market re-prices. Traders often try to filter these by looking for confluence, such as a breakout that also clears a meaningful horizontal level, or a breakout that comes with an actual shift in trend structure like a break of the most recent swing point. Volatility context matters too. A breakout during unusually thin liquidity may behave differently than one during a normal session.
Risk control matters even more with breakouts because the move can fail quickly. Many traders think about stop placement in relation to structure, for example beyond the most recent swing point or beyond the retest zone, rather than placing a stop right on the trend line itself. Position sizing also tends to be more sensitive with breakout trades, because wider stops can change your risk profile. This is not a formula or a guarantee. It is simply a reminder that breakout setups need a plan for what happens if the market immediately moves against you.
Platforms that may help with chart-based trading
If you plan to use trend line trading regularly, the platform matters. You need clear charting, responsive order execution, and transparent pricing. For UAE-based traders, regulation also matters because oversight from bodies such as the DFSA, SCA, ADGM FSRA, FCA, ASIC, or CySEC may offer a stronger framework than using a platform with unclear licensing.
Based on the available Business24-7 product data, several brokers stand out for chart-based traders. Pepperstone offers MT4, MT5, cTrader, and TradingView, with spreads from 0.0 pips on Razor and a $7 per lot commission. It is regulated by the DFSA, FCA, ASIC, CySEC, and BaFin, and has no minimum deposit. AvaTrade offers MT4, MT5, AvaTradeGO, and WebTrader with spreads from 0.9 pips and a $100 minimum deposit. It is regulated by ADGM FSRA, CBI, ASIC, and FSA Japan.
XTB may appeal to newer traders who want a simpler experience, with xStation 5, spreads from 0.1 pips, and no minimum deposit. It is regulated by the DFSA, FCA, CySEC, and KNF. Interactive Brokers is a different proposition, aimed more at experienced users who want professional-grade tools, 150+ markets, and very low pricing for higher volume, though its TWS platform can feel demanding for beginners. Its regulatory coverage includes the DFSA, SEC, FCA, and SFC.
Business24-7 generally works best as a research checkpoint before you open an account. If you want to compare charting tools, fees, and UAE regulatory coverage in more detail, browse the Technical Analysis section for strategy education, then review broker-specific resources in the site’s platform content before making a decision.
Pros and Cons
Strengths
- Trend lines are simple to learn and can help beginners understand market trend without relying on complex indicators.
- They can be used across forex, stocks, commodities, and indices, which makes them flexible for multi-asset traders.
- Trend lines often work well with support and resistance, channels, and chart patterns, giving traders useful confluence.
- They may help improve discipline by keeping your attention on market structure instead of short-term noise.
- Many regulated brokers covered by Business24-7, including Pepperstone, AvaTrade, XTB, and Interactive Brokers, provide platforms suitable for drawing and monitoring trend lines.
Considerations
- Trend lines are subjective. Two traders may draw different lines on the same chart and reach different conclusions.
- False breakouts are common, especially during high-impact news or thin liquidity conditions.
- A broken trend line does not automatically confirm a full trend reversal. It may only indicate temporary weakness.
- Short time frames can produce noisy price action, which may reduce the reliability of trend lines.
Do professional traders use trend lines, and how they reduce subjectivity
Many readers ask whether professional traders use trend lines. In practice, experienced traders often treat trend lines less like precise prediction tools and more like a way to map structure. Think of a trend line as a visual boundary that helps you plan scenarios: where a pullback might attract interest, where momentum might be weakening, and where a breakout could change the market’s behavior.
What many people overlook is that professionals tend to reduce subjectivity by tightening the rules around how a line is drawn. One approach is to define swings consistently, for example using only clear pivot highs and pivot lows that stand out on the chosen time frame, not minor fluctuations. Another approach is to require three touches before giving a line real weight. Traders also try to avoid “best fit” redrawing after the fact. If you keep moving the line every time price challenges it, you are no longer measuring structure, you are adjusting to it.
Trend lines also become less subjective when they match broader market structure. In an uptrend, higher highs and higher lows provide the underlying evidence. In a downtrend, lower highs and lower lows do the same. If a trend line suggests an uptrend but the swing structure is already failing, the line may not be telling you anything useful. That is why trend lines often work best when combined with simple structure checks and, where relevant, obvious horizontal levels.
Realistic expectations matter. Trend lines can help frame trades and improve consistency, but they do not remove risk, and they do not guarantee profitable outcomes. Market conditions shift, news can reprice instruments quickly, and spreads and execution can vary by platform and session. If you use trend lines as part of a repeatable process rather than a prediction method, they tend to be more helpful.

How to choose a trading platform for chart analysis
If trend line trading is part of your plan, your broker and platform should support that style clearly and safely. Here are the main criteria worth checking.
1. Regulation and regional credibility
For UAE residents, platforms regulated by authorities such as the DFSA, SCA, or ADGM FSRA may offer more comfort than firms with unclear regional oversight. International regulators such as the FCA, ASIC, and CySEC can also be relevant. Regulation does not remove risk, but it may improve standards around client protection, disclosures, and conduct.
2. Charting quality and platform choice
If you draw trend lines often, you need a stable charting interface with flexible time frames and clean drawing tools. Pepperstone supports MT4, MT5, cTrader, and TradingView. AvaTrade supports MT4 and MT5. XTB uses xStation 5. Interactive Brokers offers TWS and IBKR Mobile. The right fit depends on whether you want simplicity or depth.
3. Trading costs
Trend traders and breakout traders should pay close attention to spreads and commissions because frequent entries and exits can add up. Pepperstone lists spreads from 0.0 pips on Razor with a $7 per lot commission. AvaTrade lists spreads from 0.9 pips. XTB lists spreads from 0.1 pips. Interactive Brokers uses tiered or fixed pricing. Always check whether your preferred instrument is priced as a spread-only product or with added commission.
4. Market access
Your strategy may eventually expand beyond forex. If so, broader access could matter. Interactive Brokers offers stocks, options, futures, forex, bonds, ETFs, and funds across 150+ markets. Pepperstone focuses on forex, indices, commodities, crypto, and share CFDs. XTB and AvaTrade also cover a broad CFD and multi-asset mix. Match the platform to the assets you actually plan to trade.
5. Education and usability
Newer traders may benefit from a platform with strong learning support and a more intuitive interface. AvaTrade highlights comprehensive education. XTB is also known for strong education and a beginner-friendly setup. If you are still refining your trend following strategy, educational resources may matter as much as raw pricing. You can also browse Business24-7’s Trading Strategies resources to compare how different setups fit different market conditions.
Frequently Asked Questions
What is a trend line in trading?
A trend line is a line drawn across key highs or lows on a chart to show the market’s direction. Traders use it to identify trend, possible support or resistance, and potential breakouts. It is a visual tool rather than a guarantee. In most cases, the more clearly price respects the line, the more relevant it may become.
How do you draw trend lines correctly?
Start by identifying clear swing points, not random candles. In an uptrend, connect higher lows. In a downtrend, connect lower highs. Use at least two major touchpoints, while three touches often improve confidence. Keep your method consistent and avoid adjusting the line too often just to fit your bias.
Is trend line trading good for beginners?
It may be, because the concept is simple and helps beginners understand price structure. Trend lines can teach patience, trend identification, and better chart reading. The risk is that beginners sometimes force lines onto messy charts. Practicing on higher time frames first may help reduce confusion and improve consistency.
What is a trend line breakout?
A trend line breakout happens when price moves through a trend line that had been containing the market. It may suggest momentum is weakening or that the structure is changing. Still, false breaks are common. Many traders wait for a close beyond the line or a retest before acting on the move.
Do trend lines work in forex trading?
Yes, trend lines are widely used in forex trading because currency markets often move in visible directional phases. They can help identify an uptrend line, downtrend line, or a possible trend reversal. Even so, forex prices can react sharply to data releases and central bank events, so risk management remains essential.
Can a broken trend line confirm a reversal?
No, not by itself. A broken trend line may show that the prior trend is losing strength, but it does not automatically confirm a full reversal. Traders often look for added evidence such as lower highs after an uptrend break, higher lows after a downtrend break, or confluence from horizontal levels and volume.
Which platforms are useful for trend line traders in the UAE?
Based on Business24-7 product data, Pepperstone, AvaTrade, XTB, and Interactive Brokers all offer chart-capable platforms and recognized regulatory coverage. Pepperstone supports TradingView, cTrader, MT4, and MT5. AvaTrade supports MT4 and MT5. XTB offers xStation 5. Interactive Brokers offers TWS. The best fit depends on your experience level and preferred markets.
Why does regulation matter when choosing a broker?
Regulation may reduce some platform-related risks by setting standards around disclosures, client handling, and operational conduct. For UAE-based readers, entities supervised by the DFSA, SCA, or ADGM FSRA may feel more relevant, while international regulators such as the FCA, ASIC, and CySEC can also matter. Regulation does not remove trading risk or guarantee account outcomes.
Is trend line trading profitable?
It can be for some traders, but profitability depends on execution quality, market selection, risk control, and whether your approach fits the instrument and time frame you trade. Trend lines can help you define structure and possible scenarios, but they do not create an edge by themselves. Trading involves risk, and even a well-tested method can experience losing periods, especially when volatility conditions change.
Can you use trend lines for day trading?
Yes, many day traders use trend lines to stay aligned with intraday direction and to frame pullbacks and breakouts. In many cases, day traders draw key lines on a higher time frame such as 1H or 4H, then refine entries on a lower chart. This can help reduce the noise that often shows up if you only draw lines on very short time frames.
Do professional traders use trend lines?
Many do, but usually as a structure tool rather than a precise prediction line. More experienced traders often focus on consistency, such as using clear swing definitions and requiring multiple touches, and they typically combine trend lines with market structure and key horizontal levels. Trend lines can support planning and risk control, but they do not guarantee outcomes.
What is the best timeframe for trendline trading?
The best time frame depends on your trading style and holding period. Higher time frames such as 4H and Daily often produce cleaner swing points and fewer false signals, which can make trend lines easier to use consistently. Lower time frames can work for scalping or short-term day trading, but they often require tighter filters because price can be more reactive and noisy.
Key Takeaways
- Trend line trading is most useful when you draw lines from clear swing highs or lows and apply the same method consistently.
- An uptrend line tracks higher lows, while a downtrend line tracks lower highs.
- A trend line breakout may signal a change in structure, but it does not confirm a reversal on its own.
- Combining trend lines with support and resistance, chart patterns, and breakout logic may improve decision quality.
- For UAE traders, platform regulation, charting tools, and fee transparency should all be checked before opening an account.
Conclusion
Trend lines remain one of the most practical ways to read a market trend, but their value depends on how objectively you use them. If you draw them consistently, treat them as zones rather than exact prices, and confirm them with broader price structure, they can become a useful part of your trading process. They are not a shortcut to profit, and they work best alongside disciplined risk management. For readers in the UAE, it also makes sense to pair strategy education with careful broker research, especially around regulation, fees, and platform usability. If you are comparing brokers for chart-based trading, return to Business24-7 to explore our platform resources, broker reviews, and educational guides before making a final decision.
Disclaimer: The content published on Business24-7 is intended for informational purposes only and does not constitute financial advice, investment recommendations, or an endorsement of any specific platform or financial product. Trading and investing carry significant risk, including the potential loss of capital. You should conduct your own research and, where appropriate, seek independent financial advice before making any investment decisions. Business24-7 does not accept responsibility for any financial losses incurred as a result of information published on this site.
Disclaimer
eToro is a multi-asset platform which offers both investing in stocks and cryptoassets, as well as trading CFDs.
Please note that CFDs are complex instruments and come with a high risk of losing money rapidly due to leverage. 61% of retail investor accounts lose money when trading CFDs with this provider. You should consider whether you understand how CFDs work, and whether you can afford to take the high risk of losing your money
This communication is intended for information and educational purposes only and should not be considered investment advice or investment recommendation. Past performance is not an indication of future results.
Copy Trading does not amount to investment advice. The value of your investments may go up or down. Your capital is at risk.
Crypto assets are complex and carry a high risk of volatility and loss. Trading or investing in crypto assets may not be suitable for all investors. Take 2 mins to learn more
eToro USA LLC does not offer CFDs and makes no representation and assumes no liability as to the accuracy or completeness of the content of this publication, which has been prepared by our partner utilizing publicly available non-entity specific information about eToro.
Trend line trading is one of the simplest ways to read price structure, but it is also one of the easiest tools to misuse. Many traders draw lines that fit their bias instead of the market, which can lead to poor entries and weak risk control. If you are trading from the UAE and want a cleaner way to identify…