Harmonic patterns attract traders because they offer a structured way to read price swings using Fibonacci ratios rather than guesswork alone. If you trade forex, indices, commodities, or stocks from the UAE, these setups may help you spot potential reversal zones with more discipline. They are not a shortcut to profit, and they can fail, but they may improve decision-making when combined with sound risk control. This article explains the Gartley, Bat, Butterfly, and Crab in plain English, along with the AB=CD pattern, core harmonic pattern rules, and practical trading considerations. If you want broader context first, our technical analysis guide can help place harmonic trading within a wider chart-reading framework.
What harmonic patterns are
Harmonic patterns are advanced chart patterns built around repeating price structures and Fibonacci measurements. The basic idea is that markets often move in waves, and some of those waves retrace and extend in proportions that traders can measure. When those ratios line up, a trader may identify a potential reversal zone, often called a PRZ.
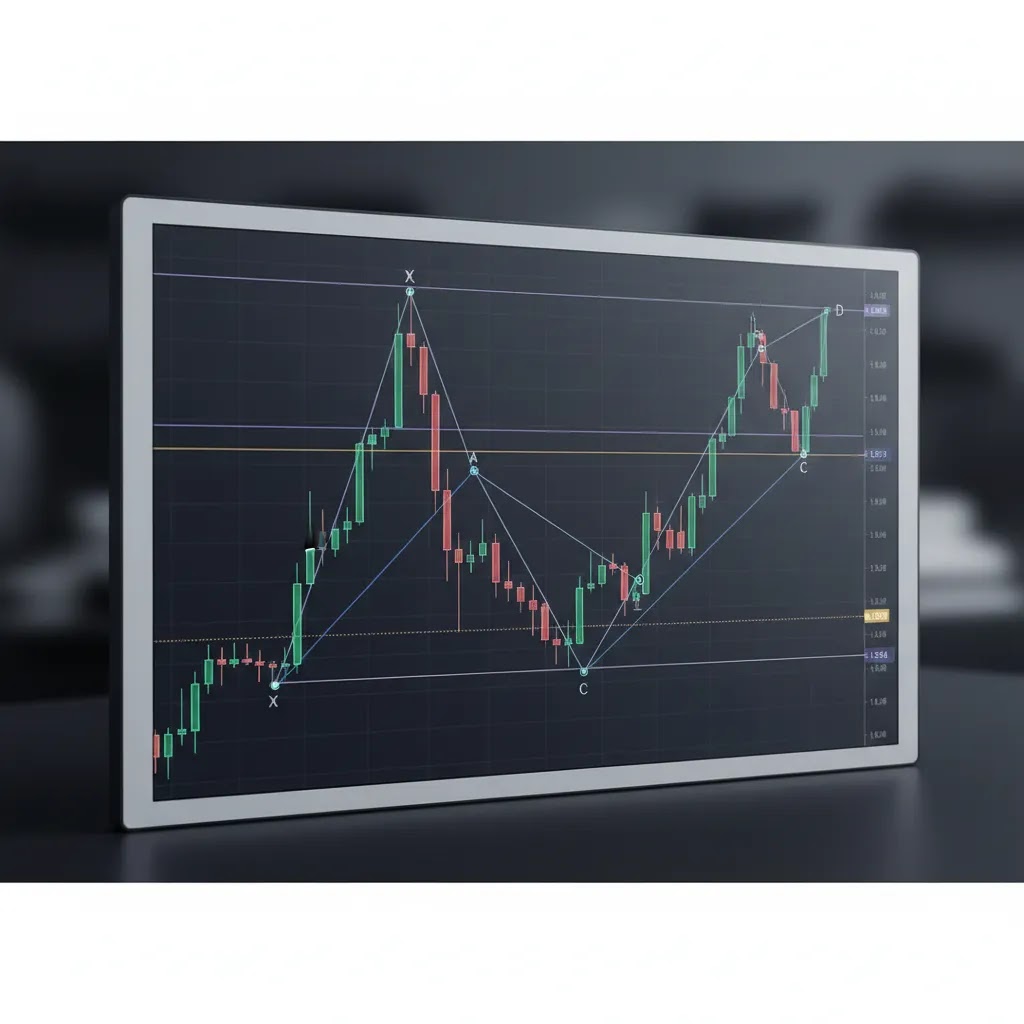
Most harmonic patterns use five points labeled X, A, B, C, and D. The path between these points creates a recognizable shape. The most widely followed structures include the gartley pattern, bat pattern, butterfly pattern, and crab pattern. Each has its own Fibonacci requirements, which is why traders often study fibonacci retracement and extension tools before attempting harmonic trading.
In forex, harmonic patterns are popular because currency pairs often produce liquid, technical price action. That said, harmonic pattern forex setups are not limited to forex. They may also appear in stock indices, commodities, and individual shares. What matters most is not the asset itself, but whether the pattern measurements are clean enough to justify a trade idea.
What traders mean by “the 5 harmonic patterns”
What many people overlook is that the phrase “the 5 harmonic patterns” is not always used consistently. In many trading communities, the “core set” refers to the Gartley, Bat, Butterfly, and Crab, plus AB=CD as the foundational symmetry pattern that shows up on its own and inside larger structures. Some educators and tools also include patterns like the Shark or Cypher as part of a broader harmonic family, but this article stays focused on the structures most commonly taught and used by retail traders.
Here’s the thing: most named harmonic patterns are part of the same XABCD family. You are still measuring how one swing relates to the next using Fibonacci retracements and extensions, and you are still trying to locate a PRZ where multiple ratios cluster. AB=CD is important because it captures the symmetry concept directly. If AB and CD are similar in length, and that symmetry aligns with a larger pattern’s completion zone, the PRZ can look more convincing on paper. That overlap is also why naming can vary by charting tool or educator. Two traders may see the same swing structure, but label it differently depending on which ratio they prioritize.
From a practical standpoint, it helps to separate “pattern recognition” from “pattern measurement.” Before you measure any ratios, you typically want a clear sequence of swings with obvious turning points, an identifiable impulse leg (often XA), and a market that is actually producing higher highs and higher lows, or lower lows and lower highs, instead of choppy overlap. You also want enough space between pivot points to measure cleanly, rather than picking anchors from tiny candles inside a tight range. If you cannot mark X, A, B, C, and D without second-guessing every line, it is usually a sign the setup is being forced.
The rules behind harmonic trading
Harmonic trading depends on ratio discipline. A pattern is not valid just because it looks visually similar to an example on social media. The legs need to align with acceptable Fibonacci relationships. In most cases, traders start by identifying XA, then measuring how far AB retraces XA, how BC retraces or extends AB, and where CD completes relative to BC and XA.
These are the practical rules many traders follow:
- Start with a clear price swing, not a messy sideways market.
- Measure every leg with Fibonacci retracement and extension tools.
- Wait for D to form inside a potential reversal zone rather than entering early.
- Use confirmation, such as rejection candles, momentum slowdown, or support and resistance.
- Define risk before entry, since harmonic setups can break decisively when the pattern fails.
This matters because harmonic patterns are more precise than many standard chart patterns. Precision can be useful, but it also means forcing imperfect setups may lead to poor trades. A pattern that is “close enough” may not be reliable enough for real money decisions.
Gartley, Bat, Butterfly, and Crab
Gartley pattern
The Gartley is often treated as the classic harmonic pattern. In a bullish version, the market rises from X to A, pulls back to B, moves higher to C, then declines to D before potentially reversing upward. In a bearish version, the structure is inverted.
A common rule is that point B retraces about 61.8% of XA, while D often completes near a 78.6% retracement of XA. Traders like the Gartley because it may appear in orderly trending markets and can offer relatively balanced risk-reward if the reversal zone holds.
Bat pattern
The Bat is similar to the Gartley but typically has a shallower B point. In many cases, B retraces closer to 38.2% or 50% of XA, while D often completes near an 88.6% retracement of XA. That deeper final retracement can make the Bat attractive to traders who prefer waiting for more price correction before looking for reversal confirmation.
The Bat may suit traders who want cleaner pullbacks and are comfortable being patient. It can be easy to confuse with the Gartley, so precise measurement matters.
Butterfly pattern
The Butterfly differs from the Gartley and Bat because D often extends beyond the original X point. In many textbook versions, B retraces 78.6% of XA, and D completes on an extension of XA, often around 127.2% or 161.8%. This gives the pattern a more aggressive terminal move.
Butterfly setups may appear near exhaustion points where the market stretches before reversing. Because the final move can be sharp, entries without confirmation may carry higher risk.
Crab pattern
The Crab is known for its extreme extension into D. It often uses a relatively modest B retracement but a very deep final extension, commonly around 161.8% of XA. The idea is that price reaches an overstretched area where a reversal becomes possible.
The Crab can produce strong reversal attempts, but it may also be one of the hardest patterns to trade emotionally. Price often accelerates into the completion zone, which can tempt traders to enter too soon. Discipline is essential.
Bullish vs bearish harmonic patterns (and the “H pattern” question)
Now, when it comes to bullish vs bearish harmonic patterns, the key point is simple: each named structure can form in either direction. The Fibonacci logic does not change. What changes is the direction of the swings and where the PRZ forms in relation to the current move. In a bullish harmonic setup, price typically sells off into point D and the PRZ sits below current price, with traders watching for a potential reversal upward. In a bearish setup, price typically rallies into point D and the PRZ sits above current price, with traders watching for a potential reversal downward.
Think of it this way: you are still measuring retracements and extensions between the same points, but the “shape” is flipped. That is why traders sometimes get confused when comparing screenshots online. One person may post a Gartley that looks different from yours, but the difference may be nothing more than bullish versus bearish orientation, or a different timeframe producing slightly different swing anchors.
Another beginner confusion point is the “H pattern” label. In many trading conversations, “H pattern” is used loosely to describe a structure that visually resembles the letter H, often two swing highs with a dip between them, or two swing lows with a bounce between them. The issue is that “H pattern” is not a formal harmonic pattern name on its own. Without the XABCD point structure and ratio requirements, it is closer to a visual nickname than a rule-based harmonic setup. If you hear someone say “H pattern,” it is usually smarter to ask which harmonic structure they actually mean, and to verify the X, A, B, C, and D pivots plus the Fibonacci relationships.
For confirmations, many traders look for similar clues at point D in both bullish and bearish patterns, but the direction matters. In bullish completions, traders often watch for selling pressure to weaken as price enters the PRZ, followed by a clear rejection from the zone or a break in lower-timeframe structure that suggests buyers are responding. In bearish completions, traders often watch for buying momentum to fade into the PRZ, then for rejection or a structure shift that suggests sellers are regaining control. None of these signals guarantee a reversal, and trading around the PRZ can be risky because volatility may spike near completion. The goal is usually to reduce random entries, not to predict the market with certainty.

How the AB=CD pattern fits in
The AB=CD pattern is one of the simplest harmonic structures and often acts as a building block inside larger patterns. The concept is straightforward: the AB leg and CD leg are expected to be similar in length, while BC serves as the retracement between them.
Many traders look for AB=CD symmetry inside Gartley, Bat, Butterfly, and Crab setups. If several measurements cluster at the same area, the potential reversal zone may appear stronger. Still, symmetry alone does not guarantee a bounce or reversal. Traders often combine it with support and resistance, trend context, and price action trading signals before acting.
Pros and Cons
Strengths
- Harmonic patterns provide rule-based structure rather than relying only on visual intuition.
- They may help traders define entry, stop-loss, and profit targets more clearly around a potential reversal zone.
- The approach works across several asset classes, including forex, indices, commodities, and stocks.
- Fibonacci measurements can improve trade consistency for traders who already use retracement and extension tools.
- Patterns like AB=CD, Gartley, and Bat can fit well within broader technical analysis workflows.
Considerations
- Pattern identification is subjective in real markets, especially when price swings are noisy.
- Exact Fibonacci measurements can be difficult for beginners to apply consistently.
- Even textbook-looking patterns can fail, especially during strong news-driven volatility.
- Waiting for full completion may reduce false entries, but it can also mean missing moves.
- Many indicator and scanner tools may produce low-quality signals if used without manual review.
Reliability, quality filters, and common failure points
The question “what is the most reliable harmonic pattern?” comes up a lot, especially from newer traders searching for a single best setup. The reality is that no harmonic pattern is inherently reliable on its own. Reliability usually depends on execution and context: clean swing structure, timeframe, volatility, trend strength, and whether your costs (spreads, commissions, and potential slippage) allow the setup to work as intended. A textbook ratio match on a chart can still produce a losing trade if the market environment is unfavorable.
Consider this: harmonic patterns can fail for predictable reasons, and many of them have nothing to do with the pattern name. Traders commonly run into issues when they force swing selection to make ratios fit, measure from the wrong anchors (especially when wicks are extreme), or treat the PRZ as a guaranteed turning point instead of an area that still needs confirmation. Patterns also tend to break more often during major news or sudden risk events, when price can move through a PRZ without respecting typical technical behavior. Even outside news, strong trends can push through reversal zones, and wide spreads or fast moves around D can create entries that look fine in theory but are difficult to execute in practice.
If you want a more practical way to judge “high quality” harmonics, a useful filter is to look for confluence and tradability rather than perfection. Traders often give more weight to setups where multiple measurements cluster tightly in the PRZ, where the completion zone aligns with a meaningful higher-timeframe level, and where a realistic stop can be placed beyond invalidation without making the trade structure unrealistic. Risk discipline matters here. Even a high quality-looking pattern can fail, so many traders limit risk per trade and avoid entering before D is actually formed, since early entries can turn a structured idea into a guess.

How to trade harmonic patterns with more caution
If you are learning how to trade harmonic patterns, the safest starting point is to treat them as a framework, not as a standalone promise of accuracy. A practical process may look like this:
- Identify a clean market swing. Avoid forcing patterns into random consolidation.
- Measure XA, AB, BC, and CD carefully. If the ratios do not align reasonably well, skip it.
- Mark the potential reversal zone at D. This is an area of interest, not an automatic entry.
- Wait for confirmation. Rejection candles, lower-timeframe structure shifts, or volume clues may help.
- Set risk first. Stop-loss placement should reflect where the pattern is invalidated, not where the loss feels comfortable.
- Manage expectations. Harmonic setups may improve structure, but they do not remove market risk.
For UAE-based traders, this matters because many platforms market technical tools heavily, yet the quality of execution, spreads, and regulation can still shape trading outcomes. If you are evaluating where to trade, it helps to review platforms through a regulation-first lens before focusing on any strategy.
Tools and platforms that may help harmonic traders
Business24-7 covers several regulated brokers that may appeal to traders who use advanced chart analysis. The right fit depends on your market focus, platform preference, and risk tolerance.
Pepperstone has a 4.5/5 rating and offers MT4, MT5, cTrader, and TradingView, with spreads from 0.0 pips on Razor and a $7/lot commission. It is regulated by DFSA, FCA, ASIC, CySEC, and BaFin. For chart-focused traders, the platform range and low-spread structure may be relevant.
AvaTrade, rated 4.5/5, offers MT4, MT5, AvaTradeGO, and WebTrader, with spreads from 0.9 pips and a $100 minimum deposit. It is regulated by ADGM FSRA, CBI, ASIC, and FSA Japan. Its education offering may help newer traders learning structured strategies.
XTB has a 4.0/5 rating, xStation 5, a $0 minimum deposit, and spreads from 0.1 pips. It is regulated by DFSA, FCA, CySEC, and KNF. Traders who want an accessible starting point may find its educational support useful.
Interactive Brokers, rated 4.5/5, offers TWS, IBKR Mobile, and Client Portal, with spreads from 0.25 pips and access to 150+ markets. It is regulated by DFSA, SEC, FCA, and SFC. It may suit experienced users who want broader market access, though its professional-grade tools can feel complex for beginners.
If you are comparing broker features, regulation, and platform usability before committing capital, you can browse the Trading Platforms and Brokers section for more platform-specific research.
Business24-7 perspective
At Business24-7, the goal is to help you separate useful charting concepts from marketing noise. Harmonic patterns can be valuable for traders who prefer rule-based analysis, but they work best when paired with realistic risk management, careful broker selection, and a clear understanding of execution costs. That is especially relevant for readers in the UAE, where regulatory oversight from bodies such as the DFSA and SCA may be an important part of the platform evaluation process.
Our editorial approach is shaped by Braden Chase’s background as a former research specialist at Forex.com and by a safety-first, evidence-based review style. If you want to build your chart reading skills further, explore our Technical Analysis resources, then compare broker features and review pages before making any platform decision.
Frequently Asked Questions
Are harmonic patterns good for beginners?
They may be useful for motivated beginners, but they are usually easier after you understand swing highs, swing lows, trend structure, and Fibonacci tools. Many new traders find harmonic setups too strict at first. Starting with simpler chart structures before moving into harmonic trading is often more practical.
Do harmonic patterns work in forex?
Yes, harmonic pattern forex trading is common because major currency pairs often show liquid and technically tradable price movement. Even so, no pattern works all the time. Spreads, slippage, and market volatility can affect outcomes, especially around economic releases or sudden geopolitical events.
What is the most common harmonic pattern?
The Gartley is one of the most recognized harmonic patterns, and the AB=CD pattern is often the easiest to understand. In practice, traders may see many near-matches that do not fully qualify. That is why exact measurement matters more than pattern names alone.
What is a harmonic pattern indicator?
A harmonic pattern indicator is a tool built into charting software or trading platforms that attempts to detect structures like Gartley, Bat, Butterfly, or Crab automatically. These tools may save time, but they can also highlight imperfect setups. Manual review is still important before placing a trade.
What is a harmonic pattern scanner?
A scanner is a broader search tool that screens multiple markets or time frames for potential harmonic setups. It may be useful for active traders watching several symbols at once. Still, scanners should be treated as filtering tools, not as confirmation that a trade is valid or low risk.
Which timeframe is best for harmonic patterns?
There is no single best timeframe. Higher timeframes may produce cleaner structures, while lower timeframes may offer more setups but also more noise. Many traders prefer starting on the 1-hour, 4-hour, or daily chart, then refining entries on a lower timeframe if needed.
How do traders place stop-loss orders on harmonic setups?
In most cases, traders place stops beyond the invalidation point of the pattern, often slightly past D or beyond the extreme swing that would clearly break the setup. Exact placement depends on volatility, spread, and the instrument traded. Risk should be set before entry, not adjusted emotionally afterward.
Are harmonic patterns enough on their own?
Usually not. Many traders combine them with trend analysis, support and resistance, momentum tools, or candlestick confirmation. Harmonic patterns may improve structure and timing, but they do not remove uncertainty. Markets can continue moving against a pattern longer than expected.
Do I need a regulated broker to trade harmonic patterns?
You need a broker to execute trades, and choosing a regulated one is usually the more cautious route. For UAE-based readers, firms overseen by bodies such as the DFSA, SCA, or other recognized regulators may offer stronger confidence than unclear or unverified operators. Regulation does not eliminate risk, but it matters.
What are harmonic patterns?
Harmonic patterns are rule-based chart structures that use Fibonacci retracements and extensions to map out repeating swing relationships. Traders use them to define a potential reversal zone (PRZ) where price may react, then look for confirmation rather than assuming the reversal will happen.
What are the 5 harmonic patterns?
Many traders use “the 5 harmonic patterns” to mean Gartley, Bat, Butterfly, Crab, and AB=CD. AB=CD is often treated as the simplest harmonic structure and a building block inside larger XABCD patterns. Some traders include additional structures like Shark or Cypher in a wider harmonic family, but the most commonly taught core set is the four XABCD patterns plus AB=CD.
Is an H pattern bullish or bearish?
“H pattern” is usually a loose visual term, not a formal harmonic pattern name with fixed Fibonacci rules. People may use it to describe either a bullish-looking or bearish-looking swing shape depending on how it forms. If you see the label used, it is typically better to identify the actual XABCD structure and confirm whether the completion at D is a bullish or bearish setup based on swing direction and ratio alignment.
What is the most reliable harmonic pattern?
No harmonic pattern is automatically the most reliable. Outcomes tend to depend on context and execution, including clean swing structure, confluence in the PRZ, alignment with higher-timeframe levels, volatility conditions, and trading costs like spreads and slippage. Harmonic patterns can fail even when ratios look correct, so risk control and confirmation are still essential.
Key Takeaways
- Harmonic patterns use Fibonacci ratios to identify possible reversal zones in a structured way.
- The Gartley, Bat, Butterfly, and Crab each have distinct measurement rules, so visual similarity is not enough.
- The AB=CD pattern often acts as a core building block inside larger harmonic structures.
- Confirmation and risk management matter because even well-formed patterns can fail.
- Broker choice still matters for harmonic traders, especially platform tools, spreads, and regulation in the UAE context.
Conclusion
Harmonic patterns can be a useful addition to your trading process if you prefer disciplined, ratio-based chart analysis. They may help organize entries and exits more clearly than purely visual trading methods, but they also demand patience, measurement accuracy, and realistic expectations. For many readers, the biggest mistake is not misunderstanding the pattern itself, but using it without proper risk control or on an unsuitable platform. Business24-7 aims to give UAE-based traders a clearer, more balanced reference point before they commit capital. If you are refining your technical approach, keep building your chart knowledge, then review regulated platform options and broker resources on Business24-7 before making your next trading decision.
Disclaimer: The content published on Business24-7 is intended for informational purposes only and does not constitute financial advice, investment recommendations, or an endorsement of any specific platform or financial product. Trading and investing carry significant risk, including the potential loss of capital. You should conduct your own research and, where appropriate, seek independent financial advice before making any investment decisions. Business24-7 does not accept responsibility for any financial losses incurred as a result of information published on this site.
Disclaimer
eToro is a multi-asset platform which offers both investing in stocks and cryptoassets, as well as trading CFDs.
Please note that CFDs are complex instruments and come with a high risk of losing money rapidly due to leverage. 61% of retail investor accounts lose money when trading CFDs with this provider. You should consider whether you understand how CFDs work, and whether you can afford to take the high risk of losing your money
This communication is intended for information and educational purposes only and should not be considered investment advice or investment recommendation. Past performance is not an indication of future results.
Copy Trading does not amount to investment advice. The value of your investments may go up or down. Your capital is at risk.
Crypto assets are complex and carry a high risk of volatility and loss. Trading or investing in crypto assets may not be suitable for all investors. Take 2 mins to learn more
eToro USA LLC does not offer CFDs and makes no representation and assumes no liability as to the accuracy or completeness of the content of this publication, which has been prepared by our partner utilizing publicly available non-entity specific information about eToro.
Harmonic patterns attract traders because they offer a structured way to read price swings using Fibonacci ratios rather than guesswork alone. If you trade forex, indices, commodities, or stocks from the UAE, these setups may help you spot potential reversal zones with more discipline. They are not a shortcut to profit, and they can fail, but they may improve decision-making…