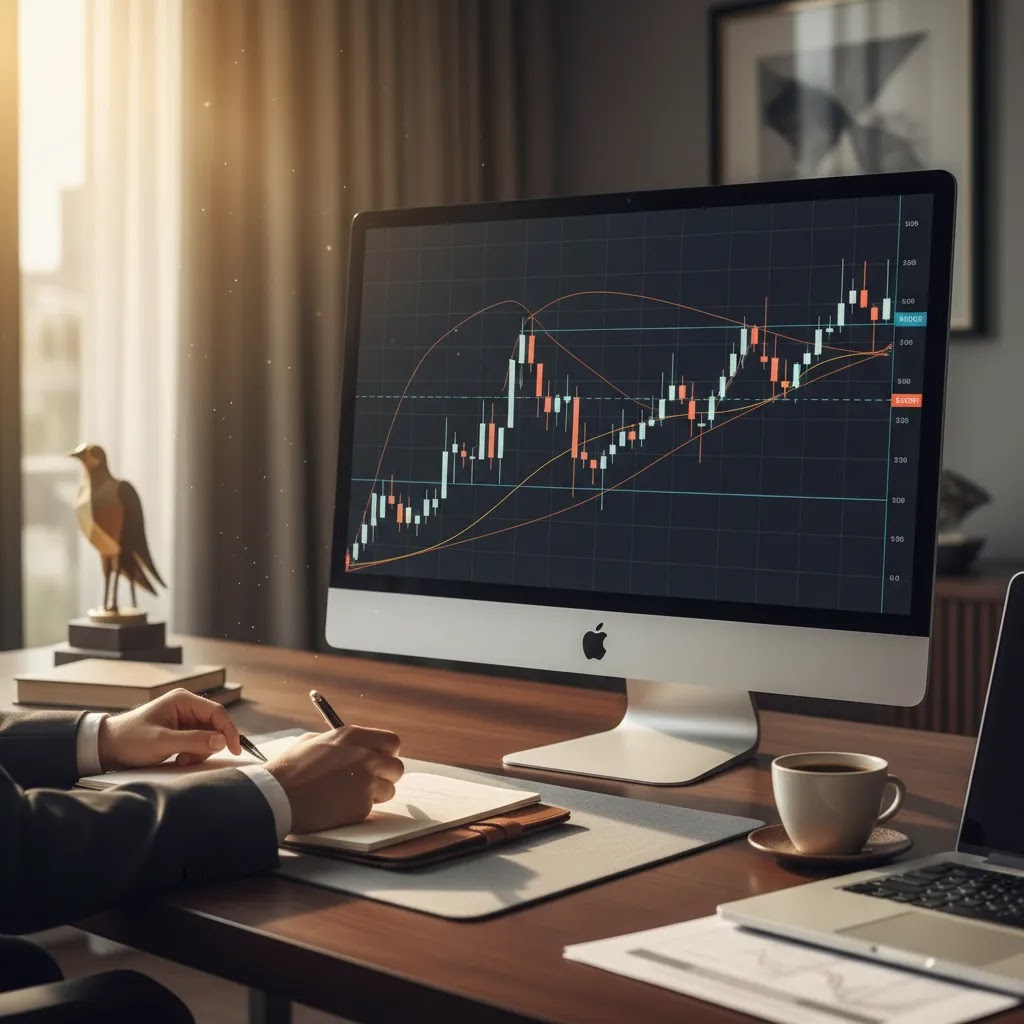
Price action trading is the practice of reading raw market movement directly from the chart, without leaning heavily on indicators. For many traders, that makes it simpler, not easier. You are still dealing with uncertainty, false breakouts, and emotional decision-making, but you are doing it with fewer moving parts on screen. This approach is especially relevant for traders who want a cleaner framework for forex, indices, commodities, or stocks and prefer to build decisions around structure, momentum, and reaction levels. If you are new to the topic, start with this technical analysis guide first. At Business24-7, our educational content is designed for UAE readers who want practical, risk-aware explanations before applying any strategy to a live market.
What Price Action Trading Means
At its core, price action trading means analyzing market behavior by watching how price moves over time. Instead of relying on multiple lagging indicators, traders focus on candlesticks, highs and lows, momentum shifts, rejection at key levels, and trend structure. The chart itself becomes the main source of information.
This is why the method is often called naked chart trading. A trader may still use a few tools, but the emphasis stays on price, not on a screen crowded with signals. In practice, that means watching how the market behaves around prior swing highs, daily opens, session ranges, and well-defined zones of support and resistance.
Price action is especially common in price action forex trading because currency markets are liquid and tend to react cleanly around technical levels. That said, the same logic may also be used in commodities, indices, and stocks. Many traders combine it with broader market structure and with context from support and resistance to avoid taking signals in random areas.
What matters most is not memorizing patterns in isolation. It is understanding where they form, what they suggest about buyers and sellers, and whether the setup fits the broader trend or range.
Core Building Blocks of Price Action
A workable price action trading strategy usually starts with four pieces: market structure, key levels, candlestick behavior, and context.
Market structure refers to the sequence of highs and lows. In an uptrend, price typically forms higher highs and higher lows. In a downtrend, it usually forms lower highs and lower lows. If that sequence breaks, momentum may be weakening.
Key levels are the areas where price has reacted before. These are not always exact lines. They are often zones. Traders mark prior highs, lows, consolidation areas, and round numbers, then watch how price behaves when it returns.
Candlestick behavior helps refine entries and exits. Long wicks, strong engulfing candles, inside bars, and rejection candles can all provide clues about short-term order flow. If you need a deeper grounding in candlestick patterns, it helps to study them in relation to trend and location, not as stand-alone triggers.
Context is what separates disciplined price action from random chart watching. A bullish candle at major support after a pullback in an uptrend may carry more weight than the same candle in the middle of a noisy range. This is also where classic chart patterns can support decision-making, especially during breakouts or continuation setups.
For beginners, the main lesson is simple: price action is not about predicting every move. It is about reading what the market is showing now, then managing risk around that information.
Common Setups and Signals
The phrase price action signals usually refers to recurring chart behaviors that traders use to frame a trade idea. Some of the most common are rejection candles, break-and-retest setups, inside bar breakouts, and trend pullbacks.
A rejection candle often shows a long wick at a level the market could not break. For example, if price tests resistance, moves above it briefly, then closes back below, traders may read that as seller strength. This does not guarantee a reversal, but it may suggest failed upside momentum.
A break-and-retest setup happens when price pushes through a clear level, then comes back to test it from the other side. If the market holds that area and resumes in the breakout direction, some traders treat it as confirmation rather than chasing the initial move.
Inside bars reflect short-term compression. They can be useful before expansion, though they often produce false breaks in low-quality environments. Trend pullbacks are another staple. In this setup, traders wait for price to retrace into a key zone within an established trend, then look for confirmation from the candle structure.
Many people search for a price action strategies pdf or a price action chart patterns pdf free download. Those can be useful as reference material, but they should not replace chart practice. A static PDF may show the pattern clearly after the fact. Live markets are much messier, and context matters more than the shape alone.
Risk, Execution, and Market Context
Price action can look clean on historical charts, but live execution is where the real difficulty starts. Spreads, slippage, overnight financing, and event volatility may all affect results, especially in leveraged products such as forex and CFDs. Capital is at risk, and losses may exceed deposits where margin trading applies.
For UAE-based traders, this matters because strategy quality and broker quality are linked. A clean setup can still perform poorly if execution is weak or costs are too high. When moving from chart study to live trading, it is sensible to use a broker that is overseen by a recognized regulator such as the Securities and Commodities Authority (SCA), the Dubai Financial Services Authority (DFSA), the Financial Conduct Authority (FCA), or the Australian Securities and Investments Commission (ASIC), depending on the entity serving your account.
Business24-7 reviews platforms with this risk-first lens. The goal is not to suggest that a strategy or broker will produce profits. It is to help readers understand what could affect trade quality, account safety, and real-world costs before they commit capital.
The “90% Rule” in Trading: What It Means and Why It Matters for Price Action
You will often hear some version of the “90% rule,” the idea that around 90% of retail traders lose money. The reality is that this is usually repeated as a cautionary statistic or rule of thumb in trading culture, not a guaranteed fact that applies evenly across all markets, brokers, and time periods. Still, the underlying warning matters: many retail traders struggle, especially when leverage, costs, and emotional decision-making are involved.
Here is the thing: when price action fails for retail traders, it is often not because a pin bar or break-and-retest “does not work.” It is typically because discretion turns into overtrading, stops are placed without a clear invalidation point, or position sizes are too large for the account. Add spreads, slippage, and sudden volatility, and a strategy that looks fine on a screenshot can become difficult to execute consistently.
From a practical standpoint, the takeaway is process and risk control. Keep position sizing rules consistent, consider avoiding high-impact news windows if you do not have a tested plan for that volatility, and track process metrics alongside results. Examples include whether you followed your entry checklist, whether the setup formed at a meaningful level, and whether you exited according to your plan. Over time, that tends to give you more useful feedback than focusing only on daily profit and loss.
Pros and Cons
Strengths
- Charts are cleaner, which may help traders focus on structure instead of reacting to too many indicators.
- The method can be applied across forex, stocks, indices, and commodities, as long as liquidity and execution are reasonable.
- It encourages context-based thinking, including trend direction, key levels, and momentum shifts.
- Price action for beginners can be easier to understand visually than more complex indicator stacks or quantitative systems.
- It pairs well with risk management because entry, stop-loss, and invalidation levels are often clearer on the chart.
Considerations
- Price action is subjective. Two traders may read the same chart very differently.
- Many signals look obvious only in hindsight, which can create false confidence during backtesting.
- Without a written plan, traders may overtrade because almost any candle can seem meaningful.
- During major news events or thin market conditions, price action patterns may fail quickly.
Is Price Action a Good Strategy? What It Can and Cannot Do
Price action can be a good strategy framework, but only if you define it as a set of rules you can repeat, not as the absence of indicators. Many traders confuse “naked charts” with “objective decisions.” The reality is that price action can become highly discretionary unless you add constraints, such as specific locations, session times, and invalidation rules.
Consider this: price action tends to be most useful in liquid markets where structure is easier to see and execution costs are usually more manageable. Higher timeframes can also reduce noise, which may help traders avoid reacting to every small fluctuation. Clear trends, well-respected support and resistance zones, and orderly pullbacks are environments where price action concepts often feel more consistent.
On the other side, price action can be unreliable during news spikes, sudden volatility events, choppy ranges, and thin sessions where spreads can widen and stop runs are more common. In those conditions, the “signal” may be real, but the execution reality can still make outcomes unpredictable, especially for short-term traders.
What many people overlook is that a “good strategy” is usually determined by testing, execution costs, and your ability to follow the plan. Two traders can trade the same price action setup and get different results because of entries, stop placement, broker conditions, and risk management choices. No method removes uncertainty. Price action is a way to organize decisions, not a guarantee of profits, and outcomes can vary widely from trader to trader.
Who Price Action Trading Is For
Price action trading may suit traders who prefer visual decision-making, want fewer tools on the chart, and are willing to spend time reviewing structure and market context. It can work well for forex traders, short-term index traders, and swing traders who want to build a repeatable chart-reading process. It may also suit UAE-based beginners who feel overwhelmed by indicator-heavy systems and want to understand how markets move before adding extra tools.
It may not suit traders who want fully mechanical rules from day one. Because discretion plays a large role, some people find the method too open to interpretation. If that is you, a more rules-based framework may be easier to test consistently.
How to Start Practicing It
Start on one market and one timeframe. That reduces noise and makes pattern recognition more realistic. Mark obvious swing highs and lows, identify the current trend or range, and draw the zones where price has reacted several times.
Next, choose one or two setups only. For example, you might focus on pullbacks in trend or rejection candles at major levels. Record the entry idea, stop location, target logic, and what invalidates the trade. Then review screenshots after each session.
A demo account may help during this stage because it allows repetition without immediate financial exposure, though demo results often differ from live execution. Keep your process simple. You do not need ten patterns. You need a small number of setups that you can recognize consistently and manage with discipline.
If you want more educational material around chart reading, browse the Technical Analysis section. If you are still building foundations, the Trading Fundamentals category is a useful next step.
Price Action Trading Practice: How to Train Your Eye (Without Overfitting)
Most traders improve faster when practice looks more like a loop than a random review session. Think of it this way: you want repeated exposure to the same situation, with a consistent way to label structure and decisions, so you can see what actually holds up over time. That also helps reduce overfitting, where you unknowingly train yourself to spot “perfect” patterns that only look clean after the move is over.
A simple practice loop is to review charts bar by bar and force yourself to make observations in the order you would in a live market. Start by marking structure and levels first: the trend or range, the most recent swing points, and the zones that clearly mattered before. Only after that, annotate what price does at the level: rejection, acceptance above or below, or consolidation. This order matters because it keeps you focused on location and behavior, not on hunting for a candle shape.
Journaling is where you can reduce hindsight bias. One practical method is to capture a screenshot before the outcome is obvious, write the invalidation point first, then record what you planned to do if price accepted or rejected the level. After the session, take a second screenshot and note whether the setup appeared at a meaningful location and whether you followed your plan. Over time, this builds a library of real decision points, not just highlight-reel winners.
Common practice mistakes are usually simple. Traders switch markets and timeframes too often, so nothing repeats enough to learn it. Others collect patterns instead of context, treating a pin bar as a signal even when it forms in the middle of noise. Another trap is relying on perfect chart examples from social media or PDFs and assuming that is what most trades look like. Live charts are often messy, and your goal is not to find perfect. It is to create a process that keeps your risk defined when the picture is unclear.
Frequently Asked Questions
What is price action in simple terms?
Price action is the movement of price shown directly on a chart. Traders study candles, highs and lows, trend direction, and reactions at important levels instead of relying mainly on indicators. The goal is to interpret current market behavior, not to predict with certainty what happens next.
Does price action trading work for beginners?
It can, especially for traders who learn visually and want a simpler chart setup. The challenge is that price action is not fully objective. Beginners often need time to learn structure, avoid overtrading, and separate good setups from average ones. Starting with one market and one setup usually helps.
Is price action better than indicators?
Not necessarily. Price action is direct and often easier to read in real time, but indicators may still help with confirmation or consistency. The better question is whether your method is clear, testable, and risk-aware. Many traders use price action first, then add a small number of supporting tools.
Which markets are best for price action forex trading?
Liquid markets are generally easier to read because price tends to react more cleanly and spreads are often tighter. Major forex pairs are a common starting point. Even then, execution quality, volatility, and news events may still distort setups, especially for short-term traders using leverage.
What are the most common price action patterns?
Common examples include pin bars or rejection candles, engulfing candles, inside bars, break-and-retest setups, and pullbacks within a trend. These patterns matter most when they form at meaningful locations, such as a major support or resistance zone, not in the middle of random market noise.
Can I trade price action without indicators at all?
Yes, many traders do. That is why the approach is often called naked chart trading. Still, removing indicators does not remove risk or subjectivity. You still need rules for entries, exits, position sizing, and invalidation. A clean chart should lead to clearer decisions, not impulsive trading.
Are PDF guides enough to learn price action?
Usually not on their own. A PDF can help you recognize patterns and terminology, but live markets do not present textbook examples every time. Real progress usually comes from repeated chart review, journaling, and testing a small number of setups under different market conditions.
What is the price action trading practice?
Price action trading practice is structured chart repetition, usually focused on one market, one timeframe, and a small number of setups. Many traders use bar-by-bar replay or step-through review, mark structure and key levels first, then record what price does at those levels, such as rejection, acceptance, or consolidation. Journaling with screenshots and a clear invalidation point can help reduce hindsight bias.
Is price action a good strategy?
It can be, but it depends on how clearly you define rules, test them, and manage execution costs and risk. Price action itself is a framework for reading the market, and it can become subjective without constraints like checklists, specific locations, and consistent stop placement. No approach removes uncertainty, and outcomes can vary by trader and market conditions.
Can I make $1000 per day from trading?
It is possible for some traders to have strong days, but setting a fixed daily income goal is one of the fastest ways to encourage overtrading and excessive risk. Day-to-day results can vary heavily due to volatility, spreads, slippage, and strategy performance in different conditions. If you are trading leveraged products like forex or CFDs, focus on risk limits and process consistency rather than trying to reach a daily dollar target.
What is the 90% rule in trading?
The “90% rule” is a common saying that suggests most retail traders lose money. It is generally used as a warning, not as a guaranteed statistic. For price action traders, the bigger message is that discretion, leverage, costs, and inconsistent risk management can overwhelm any setup if you do not have a tested plan and clear position sizing rules.
Key Takeaways
- Price action trading focuses on reading raw chart movement, market structure, and reactions at important levels.
- The method can be useful for forex, stocks, indices, and commodities, but context matters more than pattern memorization.
- Common setups include rejection candles, break-and-retest trades, inside bars, and pullbacks in trend.
- Price action is simple in appearance, but not easy in practice because interpretation and discipline matter.
- For UAE traders using leveraged products, broker regulation, spreads, and execution quality may affect real outcomes as much as strategy design.
Conclusion
Price action trading appeals to traders who want a cleaner way to read the market and build decisions around what price is doing now, not what several lagging indicators suggest after the move. Its biggest strength is clarity. Its biggest weakness is subjectivity. That means the method may work best for traders who are willing to journal, review charts carefully, and follow a structured plan rather than chase every candle. At Business24-7, we view price action as a useful framework, not a shortcut. If you want to build out your chart-reading skills further, explore our related guides on candlesticks, support and resistance, and broader technical analysis concepts before applying any strategy with real money.
This article is for informational purposes only and does not constitute personalized financial or investment advice. Trading forex, CFDs, stocks, crypto, and other financial instruments carries risk, and capital is at risk. In leveraged trading, losses may exceed deposits. If you are trading from the UAE, consider whether a provider is overseen by a relevant regulator such as the Securities and Commodities Authority (SCA) or the Dubai Financial Services Authority (DFSA), and assess whether the product is appropriate for your financial situation and risk tolerance.
Disclaimer
eToro is a multi-asset platform which offers both investing in stocks and cryptoassets, as well as trading CFDs.
Please note that CFDs are complex instruments and come with a high risk of losing money rapidly due to leverage. 61% of retail investor accounts lose money when trading CFDs with this provider. You should consider whether you understand how CFDs work, and whether you can afford to take the high risk of losing your money
This communication is intended for information and educational purposes only and should not be considered investment advice or investment recommendation. Past performance is not an indication of future results.
Copy Trading does not amount to investment advice. The value of your investments may go up or down. Your capital is at risk.
Crypto assets are complex and carry a high risk of volatility and loss. Trading or investing in crypto assets may not be suitable for all investors. Take 2 mins to learn more
eToro USA LLC does not offer CFDs and makes no representation and assumes no liability as to the accuracy or completeness of the content of this publication, which has been prepared by our partner utilizing publicly available non-entity specific information about eToro.
Price action trading is the practice of reading raw market movement directly from the chart, without leaning heavily on indicators. For many traders, that makes it simpler, not easier. You are still dealing with uncertainty, false breakouts, and emotional decision-making, but you are doing it with fewer moving parts on screen. This approach is especially relevant for traders who want…