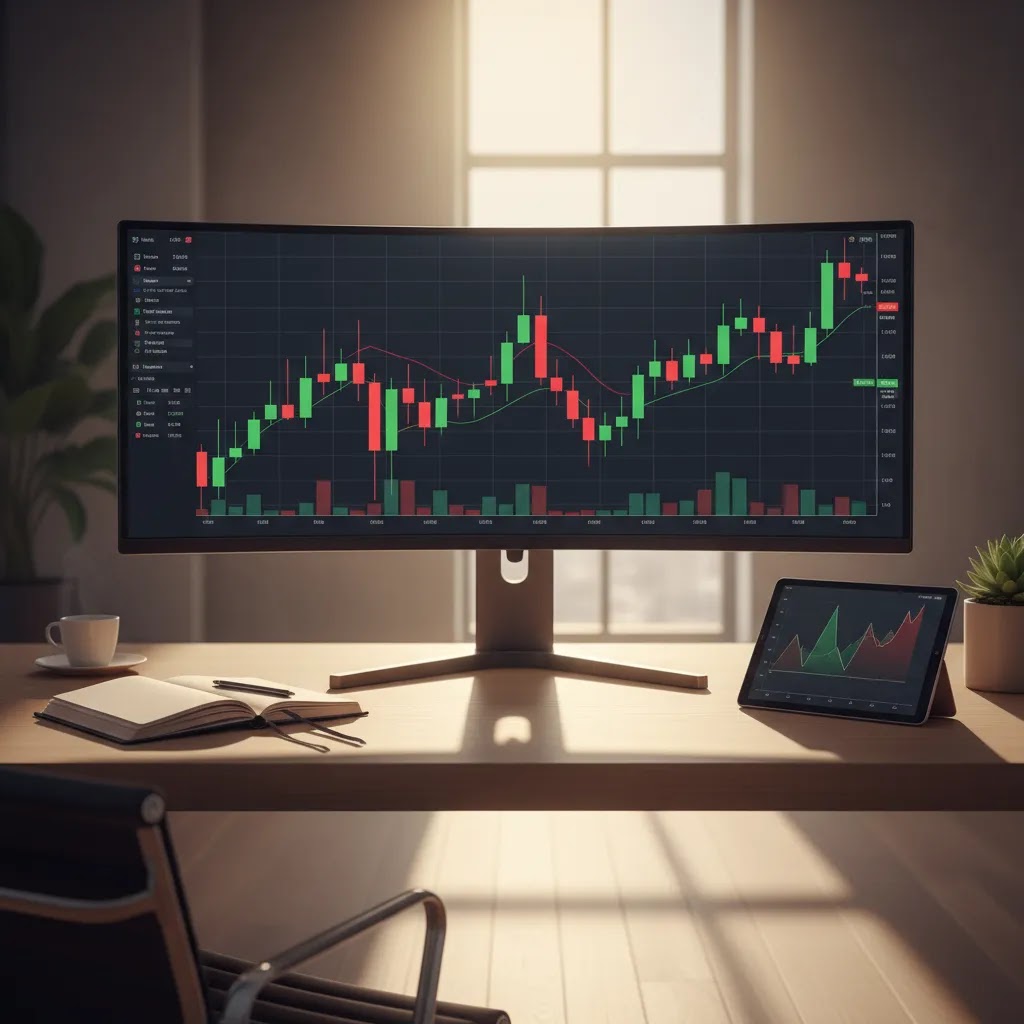
Candlestick patterns are one of the fastest ways to read price behavior without adding a screen full of indicators. For UAE traders researching technical setups, they can help show whether buyers or sellers are gaining control, where momentum may be stalling, and when a reversal could be developing. This guide explains the most important patterns in plain English, shows how to read a candlestick chart, and highlights where traders often make mistakes. It is most useful for beginners and intermediate traders who want a practical framework, not memorized names without context. At Business24-7, we treat candlestick analysis as one part of a broader technical analysis guide, not a standalone signal that guarantees results.
What Candlestick Patterns Show
A candlestick chart displays price movement over a set period. Each candle shows the open, high, low, and close. The body reflects the distance between open and close, while the wicks show how far price moved during that period before pulling back.
This format gives more information than a simple line chart. A trader can quickly see whether momentum was strong, whether the market rejected a level, or whether indecision dominated that session. That is why japanese candlestick analysis remains widely used across forex, stocks, commodities, crypto, and indices.
On their own, candlestick patterns do not predict the future. What they do is help you interpret order flow and market sentiment in a structured way. A hammer candlestick at a major support level may mean far more than the same candle appearing in the middle of a range. Context matters. That is also why candlestick work is often combined with support and resistance, trend direction, and broader Technical Analysis principles.
Key Candlestick Patterns to Know
Most traders do not need a huge candlestick patterns cheat sheet. They need a smaller list of patterns they can recognize consistently and apply with discipline.
Hammer candlestick: A bullish reversal signal that usually appears after a decline. It has a small real body near the top of the candle and a long lower wick. It suggests sellers pushed price down, but buyers stepped in strongly before the close.
Hanging man: Visually similar to a hammer, but it appears after an uptrend. It can warn that buying pressure is weakening and that a bearish reversal may be possible.
Shooting star: A bearish reversal pattern that forms after a rise. It has a small body near the low and a long upper wick, showing rejection of higher prices.
Doji: A candle where the open and close are very close together. A doji reflects indecision. It becomes more meaningful near major levels or after an extended move.
Spinning top: A candle with a small body and wicks on both sides. Like a doji, it suggests uncertainty rather than a clear directional edge.
Engulfing pattern: One of the most watched two-candle setups. In a bullish engulfing pattern, the second candle fully covers the prior bearish body, showing strong buying pressure. In a bearish engulfing pattern, the opposite happens and may signal fading upside momentum.
Morning star: A three-candle bullish reversal structure that typically forms after a decline. It often includes a strong bearish candle, a smaller indecisive candle, and then a strong bullish candle.
Evening star: The bearish counterpart to the morning star. It may suggest a reversal lower after an uptrend.
These patterns often work best when read alongside broader price action trading concepts and neighboring structures such as chart patterns.
Main Candlestick Pattern Categories (Single, Double, and Triple Candle)
What many people overlook is that candlestick patterns are easier to learn when you group them by structure. Most of the “main” patterns traders use fall into one-candle, two-candle, or three-candle families. The category matters because it changes how quickly the signal forms, and how much confirmation you typically get from the pattern itself.
Single-candle patterns: Hammer candlestick, hanging man, shooting star, doji, and spinning top are all one-candle signals. They usually highlight indecision, rejection, or a possible shift in control within a single session. Here is the thing: because they form in one candle, they often need more context to be meaningful. A doji in the middle of a range can be noise, while a doji at a major level after a sustained move can be a useful warning sign.
Two-candle patterns: The engulfing pattern is a classic two-candle structure. Two-candle setups tend to show a clearer “before and after” shift, such as sellers controlling the first candle and buyers overpowering that move on the second candle in a bullish engulfing pattern. From a practical standpoint, two-candle patterns can feel more actionable than single-candle signals because the second candle already provides part of the confirmation.
Three-candle patterns: Morning star and evening star are three-candle reversal structures. Think of it this way: the first candle shows strong trend pressure, the middle candle shows hesitation, and the third candle provides confirmation in the opposite direction. The tradeoff is patience. Three-candle patterns typically take longer to form, and by the time the structure is complete, part of the move may already have happened. In many cases, that is the price of getting more confirmation.
How to use this lens depends on your style. Beginners often do better starting with a small set of single and two-candle patterns because they are easier to spot and review on historical charts. Active traders who want more built-in confirmation may prefer three-candle structures, but they still need to filter signals using trend, key levels, and follow-through. No category overrides context, it only changes how the “story” is told across candles.
How to Read Candlestick Charts Properly
Learning how to read candlestick charts starts with three basic questions.
First, where is the pattern forming? A bullish candlestick pattern at long-term support may deserve attention. The same pattern in random mid-range price action may carry little value.
Second, what came before it? Reversal candles matter most after a clear directional move. If there was no trend or impulse before the setup, the signal is often weaker.
Third, what confirms it? Confirmation may come from the next candle, a break of a local high or low, volume expansion, or alignment with market structure.
A practical reading process could look like this:
1. Identify the trend on the time frame you trade.
2. Mark major support and resistance areas.
3. Wait for price to interact with those levels.
4. Watch for a recognizable candlestick pattern.
5. Look for confirmation rather than reacting to the candle name alone.
This approach is more useful than downloading a candlestick patterns pdf and memorizing dozens of formations with no market context. Business24-7 generally views candlestick analysis as a decision-support tool, not a complete trading system. If you are still learning the basics, the Trading Fundamentals section is a good next step.
Common Candlestick Rules Traders Use (3-Candle Rule and First Candle Rule)
Once traders get past memorizing pattern names, they often adopt simple “rules” to make candlestick reading more repeatable. These are not universal laws, and different strategies apply them differently, but two ideas show up frequently: the 3-candle rule and the first candle rule.
The 3-candle rule: In plain English, this usually means waiting up to three candles after a pattern appears to see if the market follows through in the direction the pattern suggests. For example, a hammer candlestick may look bullish, but some traders will watch the next one to three candles to see if buyers can actually push price higher, hold above the hammer’s low, or break a nearby swing high. If price fails to follow through within that window, traders may treat the setup as lower quality or invalidated. This “rule” is really a patience filter, not a guarantee that the move will work.
The first candle rule: This idea is typically used with multi-candle patterns, especially two-candle and three-candle structures. The first candle helps define the context, such as strong bearish pressure before a potential bullish reversal, and the next candle or candles either confirm that a shift is happening or show that the original pressure is still in control. Where traders misapply this is by ignoring what the first candle is telling them about trend strength. A single bullish candle after a very strong down candle can be nothing more than a pause, unless the next candles prove that selling pressure is actually fading.
The reality is that these rules are shortcuts for reading follow-through, and they vary by time frame and volatility. A “three-candle window” on a 15-minute chart is not the same as three candles on a daily chart. These heuristics also do not override risk management. Even if the next candles confirm a pattern, traders still need a plan for sizing, invalidation, and what to do if price moves against them.
Risk, Context, and Common Mistakes
The main mistake traders make with candlestick patterns is treating them like automatic buy or sell signals. A bullish engulfing candle does not mean price must rise next. A shooting star does not guarantee a reversal. Markets can ignore textbook setups, especially during major news events, low-liquidity sessions, or strong trend continuation.
Another issue is using patterns on very low time frames without filtering noise. One-minute and five-minute charts may produce frequent candles that look meaningful but have limited analytical value unless supported by structure and liquidity context.
Risk management matters just as much as pattern recognition. Trading leveraged products such as forex and CFDs carries significant risk. Capital is at risk, and losses can exceed deposits where leverage applies. UAE-based readers should also understand the regulatory framework of any broker they use, including oversight by bodies such as the Securities and Commodities Authority (SCA) or the Dubai Financial Services Authority (DFSA), where relevant.
No candlestick setup removes market risk. It may only improve how clearly you interpret what price is doing in the moment.
How Accurate Are Candlestick Patterns? What “Reliability” Really Means
A common question is whether candlestick patterns are “accurate,” or which pattern is most accurate. Consider this: candlesticks are a way to describe what price just did, not a fixed prediction of what price must do next. So reliability is usually about probability and conditions, not certainty. A pattern may perform well in one environment and fail repeatedly in another.
What influences reliability in real markets tends to be straightforward:
Trend strength: Reversal patterns often have a harder time working against a strong, sustained trend. In those conditions, bearish candlestick patterns inside an uptrend, or bullish candlestick patterns inside a downtrend, can turn into brief pullbacks rather than true reversals.
Proximity to support and resistance: Candles matter more when they form at levels other traders may be watching. A hammer candlestick at a well-tested support zone can communicate rejection clearly. The same candle in open space may be less informative.
Time frame: Higher time frames often reduce noise, but they also generate fewer signals. Lower time frames can offer more opportunities, yet they can also produce more false positives, especially in choppy sessions.
Volatility and news: During major economic releases or sudden liquidity shifts, candles can become unusually large and erratic. A pattern that looks “perfect” on the chart may be driven by a one-off headline rather than a stable shift in supply and demand.
Confirmation and follow-through: Many traders treat the next candle or two as a reality check. If the market cannot follow through, the pattern may not be doing much more than labeling a pause.
If you want a simple checklist to filter low-quality signals, use this before you give any candlestick setup extra weight:
1. Is the market trending clearly, or is it ranging and noisy?
2. Is the pattern forming at or near a meaningful support or resistance area?
3. Does the pattern show obvious rejection, or is the body and wick structure small and unclear?
4. Is there a logical invalidation point on the chart if the idea is wrong?
5. Do the next one to three candles show follow-through, or does price immediately fade?
This will not make candlesticks “guaranteed.” It can, however, help you avoid the most common trap, treating every recognizable pattern as equally tradable regardless of location, market conditions, or risk.
Pros and Cons
Strengths
- Candlestick charts show open, high, low, and close data in a format that is easy to read once the basics are learned.
- Many patterns help traders spot shifts in momentum, rejection, and indecision faster than line charts.
- They work across multiple markets, including forex, stocks, commodities, and crypto.
- They combine well with support and resistance, trend analysis, and chart structure.
- They are accessible for beginners and still useful for experienced discretionary traders.
Considerations
- Patterns are not predictive on their own and can fail often without context.
- Memorizing pattern names without understanding market structure usually leads to poor decisions.
- Lower time frames can produce noisy, misleading signals.
- Different traders may interpret the same candle formation differently.
Who Should Use Candlestick Analysis?
Candlestick analysis is most useful for traders who want a visual, price-first way to read the market. It suits beginners learning chart behavior, swing traders looking for reversal or continuation clues, and active traders who already use support zones, trend structure, or breakout logic. It may be less useful for investors who make decisions mainly from fundamentals or macro data and rarely use charts. For UAE-based retail traders, candlestick work can be a practical starting point because it is platform-independent and can be applied on most regulated broker platforms reviewed by Business24-7.
How to Start Using Candlestick Patterns
Start small and keep the process simple.
First, choose a charting platform and switch from line view to candlestick chart view. Most major platforms support this by default. Next, focus on a short list of patterns: doji, hammer, shooting star, bullish engulfing, bearish engulfing, morning star, and evening star.
After that, review historical charts and note where these patterns formed relative to trend and key levels. You are looking for repeatable context, not just familiar shapes. Then move to a demo environment before risking real capital. Record each setup, why you took it, and what confirmation you required.
Over time, build your own working cheat sheet with screenshots. That tends to be more useful than a generic candlestick patterns cheat sheet downloaded online because it reflects the markets and time frames you actually trade.
Frequently Asked Questions
What is the most reliable candlestick pattern?
No single candlestick pattern is reliably superior in all market conditions. Traders often favor engulfing patterns, hammers, and shooting stars, but their effectiveness usually depends on trend, support or resistance, and follow-through from the next candles. Context generally matters more than the pattern name itself.
Are bullish candlestick patterns enough to enter a trade?
Usually not. Bullish candlestick patterns may signal that selling pressure is fading, but traders often wait for confirmation such as a break of nearby resistance, a higher low, or strong follow-through on the next candle. Entering on the pattern alone can increase the chance of false signals.
What does a doji mean on a candlestick chart?
A doji usually shows indecision because the open and close are close together. Buyers and sellers pushed price around during the session, but neither side finished with a clear advantage. A doji near support, resistance, or after a strong trend can be more meaningful than one inside choppy price action.
Is a hammer candlestick always bullish?
Not always. A hammer candlestick may suggest a bullish reversal only if it appears after a decline and ideally near an important support area. If it forms in the middle of a range or without confirmation, it may have little predictive value. Location and follow-through are essential.
What is the difference between a shooting star and a hanging man?
A shooting star forms after an uptrend and has a long upper wick, suggesting rejection of higher prices. A hanging man also appears after a rise, but it has a long lower wick. Both may warn of weakness, yet each reflects a different intraperiod struggle between buyers and sellers.
Do candlestick patterns work in forex and crypto?
They can be used in forex, crypto, stocks, indices, and commodities because they are based on price movement rather than a specific asset class. Their usefulness may vary by market conditions, volatility, and time frame. Traders should still use risk controls, especially in leveraged products.
Should I use a candlestick patterns pdf or make my own notes?
A downloadable candlestick patterns pdf can help with early memorization, but many traders benefit more from building their own notes using charts they have reviewed themselves. Personal examples often improve recognition, reinforce context, and make it easier to separate high-quality setups from weak ones.
Which is the most accurate candlestick pattern?
There is no single “most accurate” candlestick pattern across all markets and time frames. Candlestick signals are probabilistic and their reliability often improves when the pattern forms in the right context, such as near support and resistance, after a clear trend move, and with follow-through on the next candles. It is usually more useful to ask whether the setup is high-quality in the current conditions than to look for one pattern that always works.
What is the 3 candle rule?
The 3 candle rule is a common confirmation idea where traders watch up to three candles after a pattern appears to see if price follows through. If the market cannot hold the level implied by the pattern, or if there is no follow-through within that short window, some traders treat the setup as weaker or invalidated. How it is applied depends on the strategy and the time frame.
What are the main candlestick patterns?
Many traders focus on a small core set: hammer candlestick, hanging man, shooting star, doji, spinning top, engulfing pattern, morning star, and evening star. These cover key ideas such as rejection, indecision, and reversal confirmation. Their usefulness typically depends on where they form in relation to trend and support or resistance.
What is the first candle rule?
The first candle rule is a practical way some traders read multi-candle patterns. The first candle sets the context, such as strong bearish pressure before a potential bullish reversal, and the next candle or candles confirm or invalidate that idea. Traders can misapply it by ignoring the strength of the move represented by the first candle and assuming a reversal is underway without clear follow-through.
Key Takeaways
- Candlestick patterns help visualize momentum, rejection, and indecision through open, high, low, and close data.
- The most useful setups include doji, hammer, shooting star, engulfing pattern, morning star, and evening star.
- Pattern quality depends heavily on context, especially trend, support and resistance, and confirmation.
- Candlestick analysis is a tool, not a guarantee, and should be paired with sound risk management.
- Business24-7 readers can use candlestick study as part of a wider technical framework before choosing a trading platform or strategy.
Conclusion
Candlestick patterns are worth learning because they train you to read price behavior directly rather than depending only on lagging indicators. Their real value is not in memorizing dozens of names. It is in understanding what each candle says about buyers, sellers, momentum, and rejection at important market levels. For most traders, a smaller watchlist of reliable patterns used with structure and confirmation is enough. If you want to build that skill further, explore Business24-7 resources on chart patterns, support and resistance, and price action trading to develop a more complete technical framework.
This article is for informational purposes only and does not constitute personalized financial, investment, or trading advice. Trading forex, CFDs, crypto, stocks, and other financial instruments involves risk. Capital is at risk, and losses may exceed deposits where leverage is used. Readers in the UAE should verify whether any broker or platform is authorized or regulated by the Securities and Commodities Authority (SCA), the Dubai Financial Services Authority (DFSA), or another relevant regulator before opening an account.
Disclaimer
eToro is a multi-asset platform which offers both investing in stocks and cryptoassets, as well as trading CFDs.
Please note that CFDs are complex instruments and come with a high risk of losing money rapidly due to leverage. 61% of retail investor accounts lose money when trading CFDs with this provider. You should consider whether you understand how CFDs work, and whether you can afford to take the high risk of losing your money
This communication is intended for information and educational purposes only and should not be considered investment advice or investment recommendation. Past performance is not an indication of future results.
Copy Trading does not amount to investment advice. The value of your investments may go up or down. Your capital is at risk.
Crypto assets are complex and carry a high risk of volatility and loss. Trading or investing in crypto assets may not be suitable for all investors. Take 2 mins to learn more
eToro USA LLC does not offer CFDs and makes no representation and assumes no liability as to the accuracy or completeness of the content of this publication, which has been prepared by our partner utilizing publicly available non-entity specific information about eToro.
Candlestick patterns are one of the fastest ways to read price behavior without adding a screen full of indicators. For UAE traders researching technical setups, they can help show whether buyers or sellers are gaining control, where momentum may be stalling, and when a reversal could be developing. This guide explains the most important patterns in plain English, shows how…