
Bollinger Bands are one of the most widely used chart tools because they help you judge volatility, spot possible breakouts, and put price movement into context. For UAE-based traders comparing forex, stock, and CFD opportunities, that can be useful, especially if you want a structured way to read changing market conditions without relying on guesswork. This indicator is not a prediction machine, and it may produce false signals in fast markets, but it can still be a practical part of a disciplined trading process. If you are still building your chart-reading foundation, our technical analysis guide gives broader context before you apply Bollinger Bands to live markets.
What Bollinger Bands are and how they work
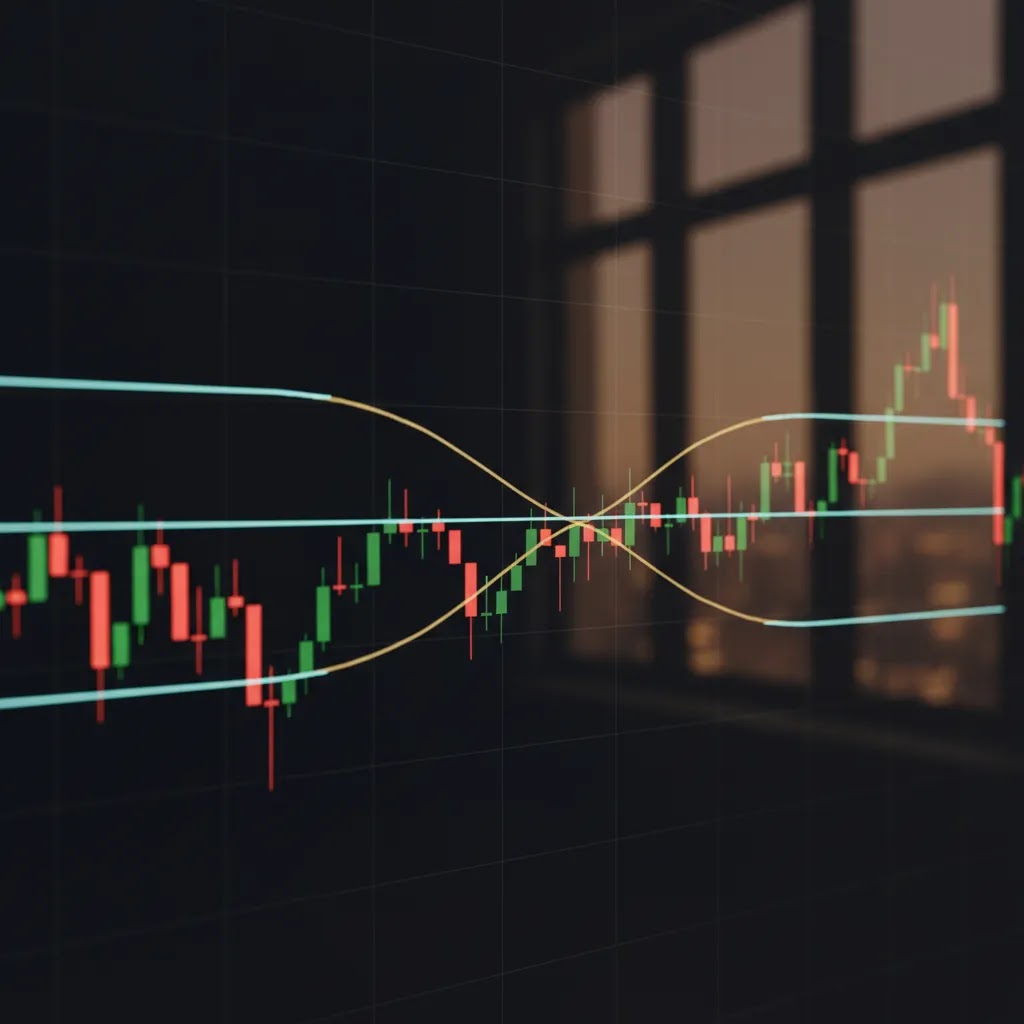
The Bollinger Bands indicator typically consists of three lines. The middle line is usually a moving average, and the upper and lower bands are plotted a set number of standard deviations away from that average. In plain language, the bands expand when price volatility rises and contract when volatility falls.
This matters because price does not move in a straight line. Markets often alternate between quieter periods and more active ones. Bollinger Bands help you see that shift visually. A narrow band setup may suggest consolidation, while widening bands may indicate stronger directional movement or a more volatile environment.
Many traders use Bollinger Bands in forex, indices, stocks, and commodities because the logic is flexible. Still, the indicator works best as a context tool, not as a standalone buy or sell trigger. In most cases, traders combine it with trend analysis, support and resistance, or momentum tools such as the rsi indicator to reduce weak entries.
If you use leveraged products such as CFDs or forex, remember that volatility can increase both opportunity and risk. Capital is at risk, and indicator-based trading signals may fail during news events or thin market conditions.
How Bollinger Bands are calculated (the simple formula)
From a practical standpoint, Bollinger Bands are built from two parts: a moving average baseline, plus a volatility measure that sets how wide the envelope should be. Most platforms use the same default logic.
The middle band is typically a simple moving average (SMA). The default is often a 20-period SMA, meaning it averages the last 20 candles of price (usually the close) and plots that average as a line.
The upper band and lower band are then calculated by taking that middle SMA and adding or subtracting a multiple of the standard deviation:
- Upper band = SMA(Period) + (Standard Deviation(Period) × Multiplier)
- Lower band = SMA(Period) – (Standard Deviation(Period) × Multiplier)
Standard deviation is a way of measuring dispersion, meaning how spread out recent prices are around the average. In this context, it is commonly treated as a proxy for volatility. When prices start swinging more aggressively, standard deviation rises, so the bands widen. When price action tightens and candles cluster closer to the average, standard deviation falls, so the bands narrow.
What many people overlook is that Bollinger Bands have two key inputs that control how sensitive the indicator will be: the Period and the standard deviation multiplier (often 2 by default). A shorter Period typically reacts faster to new price information, which can increase the number of signals but also increase noise. A longer Period usually smooths the middle band, which can reduce signal frequency but may lag when conditions change quickly. The multiplier controls band width: a smaller multiplier tightens the bands and increases touches, while a larger multiplier widens the bands and can reduce touches, but may also delay “extreme” readings.
Common Bollinger Bands settings
The default Bollinger Bands settings on many charting platforms are a 20-period moving average with bands set at 2 standard deviations. That is often the starting point for beginners because it balances responsiveness with noise control.
Here is what those settings generally mean:
- 20-period average: a medium-term baseline that many swing traders and day traders consider practical.
- 2 standard deviations: a common setting used to show how far price has moved from its average relative to recent volatility.
- Shorter periods: may react faster but can create more false signals.
- Longer periods: may smooth out noise but can lag in rapidly changing markets.
There is no single best Bollinger Bands settings choice for every market. A trader using 5-minute charts may prefer a more responsive setup than someone analyzing daily charts. Bollinger bands scalping approaches, for example, often use shorter timeframes and stricter confirmation rules, while position traders may stay closer to the standard default.
The key is consistency. If you keep changing settings to fit past price action, you may end up curve-fitting your chart rather than building a repeatable method. It usually makes more sense to test one setup over a meaningful sample size and only adjust it if market behavior or your timeframe truly requires it.
Best Bollinger Bands settings by market and timeframe (starting points)
Now, when it comes to settings, it helps to think in “starting point ranges” rather than searching for one perfect input. Different markets and timeframes behave differently, and your goal is usually to balance responsiveness with reliability.
On intraday charts like 1-minute to 15-minute, traders often experiment with shorter periods (for example, 10 to 20) because intraday structure can change quickly. Some also reduce the standard deviation multiplier (for example, from 2.0 down toward 1.5 to 1.8) to keep bands tighter and generate more interactions. The trade-off is that tighter bands can increase signal frequency, but they can also increase whipsaws, especially during low-liquidity periods or around session transitions.
On hourly to daily charts, the default 20 and 2 is common because it tends to be stable enough to reflect broader conditions. Traders who want fewer signals with potentially “cleaner” extremes may widen bands (for example, increasing the multiplier toward 2.5). The trade-off is fewer touches and fewer apparent breakouts, but also more lag before the indicator flags an overextended move.
On weekly charts or longer-term trend analysis, some traders increase the period (for example, 30 to 50) to smooth out noise. This can help keep the middle band aligned with longer-term direction, but it can also react late when a trend shifts.
Think of it this way: tighter settings can help you see more short-term structure, but they may produce more false positives. Wider settings can reduce noise, but they can also delay information. If you adjust inputs, it usually makes sense to backtest or forward-test the change across a meaningful sample of trades, then keep the inputs stable long enough to judge whether the improvement is real or just curve-fitting to recent price action.
Core Bollinger Bands signals traders watch
Most Bollinger Bands trading approaches focus on a few recurring patterns. These patterns can be useful, but they should be treated as clues, not guarantees.
The squeeze
A Bollinger bands squeeze happens when the upper and lower bands contract noticeably. This may signal a period of low volatility and market compression. Traders often watch for this because quiet periods can be followed by larger moves. The squeeze itself does not tell you direction. It only suggests that a breakout could be approaching.
Band breakouts
A move above the upper band or below the lower band may indicate momentum. Some traders treat this as a Bollinger band breakout signal, especially if volume or trend context supports the move. Others wait for a candle close and additional confirmation because price can briefly push outside a band and then reverse.
Mean reversion setups
In range-bound markets, price touching or piercing an outer band may suggest overextension relative to recent volatility. Traders looking for mean reversion may watch for price to rotate back toward the middle band. This approach may work better in sideways markets than in strong trends, where repeated touches of the outer band can continue without a reversal.
Middle band as a reference level
The middle band can sometimes act as a dynamic support or resistance area. In an uptrend, traders may look for pullbacks to the middle band as possible continuation zones. In a downtrend, the same line may act as resistance.
These signals often become more useful when compared with other forex indicators rather than used in isolation.
How to interpret band touches correctly (and avoid the common trap)
Here is the thing: one of the most common beginner mistakes is treating an outer-band touch as an automatic “overbought” or “oversold” signal. In reality, price can touch or ride an outer band for extended periods in a strong trend. That is often referred to as a “band walk,” and it can reflect trend strength rather than exhaustion.
A more practical rule of thumb is to look at what happens after the touch. In many cases, traders look for some combination of context and follow-through, such as whether price is closing outside the band, whether it keeps making higher highs or lower lows, and whether the move is supported by clean structure. A single spike beyond the band that immediately snaps back may be closer to an exhaustion move, but it is not a guarantee.
Consider this: band touches tend to be more meaningful when you filter them. Common confirmation filters include trend context (range versus trend), nearby support and resistance, and momentum tools such as RSI. Some traders also focus on the candle close rather than the wick, since wicks can reflect temporary liquidity grabs rather than a real shift in direction.
There are also situations where band-based signals can be less reliable. News-driven volatility spikes, sudden gaps, and thin liquidity conditions can force price outside bands quickly and then reverse just as quickly. If you trade leveraged markets, those conditions can amplify risk. It is often safer to wait for the market to stabilize than to assume the first outer-band touch is a high-probability reversal.
Simple Bollinger Bands strategy ideas
A practical bollinger bands strategy usually starts with one question: are you trading a range or a trend? The indicator can support both approaches, but the setup rules should differ.
1. Squeeze and breakout approach
- Look for a visible Bollinger bands squeeze.
- Mark nearby support and resistance levels.
- Wait for a confirmed breakout beyond the range.
- Use the middle band or recent structure for risk control.
This setup may suit traders who want to capture expanding volatility. It can also produce false breakouts, especially around major economic releases.
2. Trend continuation approach
- Identify the broader market trend first.
- Wait for price to pull back toward the middle band.
- Look for confirmation from candlestick structure or momentum.
- Avoid forcing trades if the market is choppy.
This can be a cleaner way to use Bollinger Bands because you are trading with the trend rather than fading every strong move.
3. Bollinger Bands with RSI
Many traders use Bollinger bands with RSI to filter low-quality entries. For example, if price tags the lower band while RSI also suggests weakening downside momentum, that may support a bounce thesis in a range. If price breaks the upper band while RSI stays strong, that may support a continuation view. Our guide to the rsi indicator explains how that confirmation process may work in more detail.
4. Short-term scalping use
Bollinger bands scalping can appeal to active traders, but it requires fast execution, tight risk control, and realistic expectations. Spreads, slippage, and commissions can matter more at lower timeframes. If you are testing very short-term methods, it also helps to review a broader scalping strategy framework before relying on a single indicator.
Platforms that support Bollinger Bands trading
If you plan to use Bollinger Bands in live markets, the quality of your platform matters almost as much as the indicator itself. Based on available Business24-7 platform data, several brokers offer charting environments where traders commonly use standard indicators such as Bollinger Bands.
Pepperstone supports MT4, MT5, cTrader, and TradingView, with spreads from 0.0 pips on Razor and a $7/lot commission. It is regulated by DFSA, FCA, ASIC, CySEC, and BaFin, and may appeal to active traders who want flexible charting.
AvaTrade offers MT4, MT5, AvaTradeGO, and WebTrader, with spreads from 0.9 pips and a $100 minimum deposit. It is regulated by ADGM FSRA, CBI, ASIC, and FSA Japan. UAE readers may value its ADGM regulation and AED account support.
XTB provides xStation 5 and mobile access, with spreads from 0.1 pips and a $0 minimum deposit. It is regulated by DFSA, FCA, CySEC, and KNF. Its educational offering may suit traders who are still learning indicator-based setups.
Capital.com offers web, mobile, and MT4 access, with spreads from 0.6 pips and a low $20 minimum deposit. It is regulated by the SCA, FCA, CySEC, and ASIC. For UAE-based readers, SCA regulation may be a relevant trust factor.
eToro provides WebTrader and mobile charting, a $200 minimum deposit, and spreads from 1.0 pips. It is regulated by CySEC, FCA, ASIC, and ADGM, and includes social trading tools. That may suit traders who want a simpler interface, although advanced chart customization may be more limited than on specialist trading platforms.
If you are comparing platforms before opening an account, Business24-7 can be a useful reference point. The site focuses on UAE-relevant regulation, fee transparency, and practical platform differences rather than marketing claims. You can browse the Technical Analysis section for indicator education, then review broker-specific coverage through the Broker Reviews hub before making a final decision.

Pros and Cons
Strengths
- Bollinger Bands are easy to understand visually, even for newer traders.
- The indicator helps show changing volatility, which can improve trade timing and risk awareness.
- It can be applied across multiple asset classes, including forex, stocks, indices, and commodities.
- It works in several styles, including breakout trading, trend continuation, and mean reversion analysis.
- It combines well with momentum tools, support and resistance, and price action methods.
Considerations
- Bollinger Bands do not predict direction on their own, especially during a squeeze.
- Outer-band touches are not automatic reversal signals and may fail badly in strong trends.
- Short-term trading with Bollinger Bands can be heavily affected by spreads, commissions, and slippage.
- Changing settings too often may lead to overfitting rather than better decision-making.
How to choose a platform for Bollinger Bands trading
If you plan to use technical indicators regularly, broker selection should be more than a search for low spreads. A platform may look attractive on pricing alone, but weak charting, unclear regulation, or poor execution could undermine your trading process.
Start with regulation and trust. For UAE-based traders, oversight from bodies such as the DFSA, SCA, or ADGM FSRA may provide an extra layer of reassurance. International regulators such as the FCA, ASIC, and CySEC can also matter. Regulation does not remove market risk, but it may improve standards around client protection and operational conduct.
Next, review cost structure. If your method involves frequent entries, such as short-term breakout or scalping trades, spreads and commissions can affect outcomes more than many beginners expect. Pepperstone lists 0.0 pips on Razor with a $7/lot commission, while Capital.com uses spread-only pricing from 0.6 pips. The right choice may depend on how often you trade and which instruments you use.
Then assess platform quality. MT4, MT5, cTrader, TradingView, xStation 5, and proprietary web platforms all handle indicators differently. Some traders want advanced chart customization and multi-screen layouts. Others prefer a simpler interface that helps them stay disciplined.
You should also compare market access. If you only trade major forex pairs, your needs may be simple. If you want to apply Bollinger Bands across stocks, ETFs, commodities, and indices, multi-asset access could matter more. eToro, XTB, and Interactive Brokers each approach this differently, so product range should be matched to your actual plan, not assumed future use.
Finally, look at practical usability. Minimum deposit, AED funding options, mobile functionality, Islamic account availability, and local support may all matter for UAE residents. A platform that fits your routine and risk tolerance is often more useful than one with a longer feature list that you never use. You can also browse broader education in the Trading Strategies section if you want to compare how indicators fit into complete trading plans.
Frequently Asked Questions
What are Bollinger Bands used for in trading?
Bollinger Bands are typically used to measure volatility and identify possible breakout, continuation, or mean reversion setups. They help you see whether the market is relatively quiet or active. The indicator may be useful for timing analysis, but it should usually be combined with trend context, support and resistance, or another confirmation tool.
What are the best Bollinger Bands settings?
The most common default is a 20-period moving average with bands set at 2 standard deviations. That setup is a starting point, not a rule. The best setting may depend on your timeframe, asset class, and strategy. In most cases, consistency and testing matter more than searching for a perfect universal input.
How do you use Bollinger Bands in forex?
In forex, traders often use Bollinger Bands to spot low-volatility squeezes, breakout conditions, and pullbacks within a trend. The indicator may be especially helpful during active sessions, but false signals can still happen around economic news. If you trade leveraged forex products, remember that losses can exceed expectations if risk controls are weak.
What is a Bollinger Bands squeeze?
A Bollinger Bands squeeze occurs when the upper and lower bands narrow significantly. This usually reflects reduced volatility and price compression. Traders monitor squeezes because larger moves may follow, but the pattern does not confirm direction by itself. Many wait for a confirmed breakout and supporting price action before taking a trade.
Can Bollinger Bands be used with RSI?
Yes, many traders use Bollinger Bands with RSI to add momentum confirmation. For example, an outer-band touch paired with a diverging or weakening RSI reading may support a reversal case in range conditions. In a trend, strong RSI readings may support continuation instead. This combination may help filter weaker signals, but it does not eliminate risk.
Are Bollinger Bands good for scalping?
They can be, but short-term trading raises the importance of execution quality, spread costs, and discipline. Bollinger bands scalping may work better when the market has clear structure and liquidity. In highly erratic conditions, the indicator can generate noise. Traders should test any lower-timeframe method carefully before risking live capital.
Do Bollinger Bands work for stocks as well as forex?
Yes, the indicator is commonly used across stocks, forex, indices, and commodities because it reflects volatility behavior rather than one specific asset type. That said, no indicator works equally well in every market condition. A stock in a strong earnings-driven trend may behave very differently from a quiet currency pair in consolidation.
Which brokers available to UAE traders support Bollinger Bands?
Several brokers covered by Business24-7 offer charting platforms where Bollinger Bands are commonly available, including Pepperstone, AvaTrade, XTB, Capital.com, and eToro. The better choice may depend on regulation, fee structure, platform depth, and account needs. UAE traders should also check whether the broker is regulated by the DFSA, SCA, or ADGM FSRA where relevant.
Are Bollinger Bands enough on their own?
Usually not. Bollinger Bands can provide useful context, but using them alone may lead to weak decisions, especially in trending or news-driven markets. Many traders combine them with support and resistance, trend structure, volume, or momentum tools. A broader process often matters more than any single indicator setting.
What do Bollinger Bands tell you?
Bollinger Bands primarily tell you how volatile the market has been relative to its recent average. When the bands are narrow, volatility is lower and price is consolidating more tightly. When the bands expand, volatility is rising and price is moving more aggressively. Traders often use that information to frame other decisions, such as whether a breakout is more likely after compression, or whether a trend move is showing strong follow-through.
Which is better, Bollinger Bands or MACD?
They measure different things, so “better” depends on what you are trying to confirm. Bollinger Bands are volatility-based and help you visualize compression and expansion around a moving average. MACD is momentum and trend-based and is often used to judge direction, momentum shifts, and possible trend changes. Many traders use them together, for example using Bollinger Bands to spot a squeeze and MACD to support whether momentum is building in a particular direction. None of these tools can remove market risk, especially in fast or leveraged markets.
Which Bollinger Band is best?
Each band has a different role, and the “best” one depends on the market context. The middle band (the moving average) is often used as a trend and pullback reference. The upper and lower bands are often used as volatility boundaries, which can help highlight when price is stretched relative to its recent average. In strong trends, repeated interaction with an outer band can reflect trend strength rather than a clear reversal signal, so it is usually better to interpret the bands in context instead of prioritizing one line in isolation.
What is the rule for Bollinger Bands?
There is no single official rule that works across all markets, but a common practical framework is: treat Bollinger Bands as a volatility and context tool first, then use confirmation before acting on touches or breaks. Traders often watch squeezes for potential expansion, look for candle closes and follow-through on breakouts, and use trend context to decide whether an outer-band touch is more likely to be continuation (a band walk) or a possible mean reversion setup. The goal is not certainty, it is improving decision quality while keeping risk controlled.
Key Takeaways
- Bollinger Bands help visualize volatility and may support breakout, trend, and mean reversion analysis.
- The default 20,2 setup is a practical starting point, but not a universal best setting.
- A Bollinger bands squeeze may warn of an upcoming move, but it does not confirm direction.
- Combining Bollinger Bands with RSI, price action, or support and resistance may improve signal quality.
- Platform choice matters because regulation, fees, charting quality, and execution can affect real trading results.
Conclusion
Bollinger Bands remain popular because they turn volatility into something you can see and interpret quickly. Used carefully, they may help you identify compression, momentum shifts, and possible pullback zones. Used carelessly, they can encourage overtrading or false confidence, especially in fast or leveraged markets. The better approach is to treat them as one part of a broader method that includes risk control, market context, and platform selection. If you are comparing brokers before applying Bollinger Bands in live trading, return to Business24-7 for UAE-focused research on regulation, fees, and usability. Reading detailed platform reviews and side-by-side comparisons may help you narrow your options with more confidence and less noise.
Disclaimer: The content published on Business24-7 is intended for informational purposes only and does not constitute financial advice, investment recommendations, or an endorsement of any specific platform or financial product. Trading and investing carry significant risk, including the potential loss of capital. You should conduct your own research and, where appropriate, seek independent financial advice before making any investment decisions. Business24-7 does not accept responsibility for any financial losses incurred as a result of information published on this site.
Disclaimer
eToro is a multi-asset platform which offers both investing in stocks and cryptoassets, as well as trading CFDs.
Please note that CFDs are complex instruments and come with a high risk of losing money rapidly due to leverage. 61% of retail investor accounts lose money when trading CFDs with this provider. You should consider whether you understand how CFDs work, and whether you can afford to take the high risk of losing your money
This communication is intended for information and educational purposes only and should not be considered investment advice or investment recommendation. Past performance is not an indication of future results.
Copy Trading does not amount to investment advice. The value of your investments may go up or down. Your capital is at risk.
Crypto assets are complex and carry a high risk of volatility and loss. Trading or investing in crypto assets may not be suitable for all investors. Take 2 mins to learn more
eToro USA LLC does not offer CFDs and makes no representation and assumes no liability as to the accuracy or completeness of the content of this publication, which has been prepared by our partner utilizing publicly available non-entity specific information about eToro.
Bollinger Bands are one of the most widely used chart tools because they help you judge volatility, spot possible breakouts, and put price movement into context. For UAE-based traders comparing forex, stock, and CFD opportunities, that can be useful, especially if you want a structured way to read changing market conditions without relying on guesswork. This indicator is not a…