If you trade forex, stocks, gold, or indices, reading candlesticks well may help you make calmer, more structured decisions. A good candlestick cheat sheet gives you a fast way to recognize common bullish and bearish signals, but patterns should never be used in isolation. For UAE-based traders especially, where many people are comparing platforms, chart tools, and risk controls before funding an account, it helps to understand what price action may be showing before you rely on it. This guide explains 20 of the most important candlestick patterns in plain English, what they may suggest, and where they can mislead you. If you want broader context first, start with our technical analysis guide and then return to this pattern reference.
What a candlestick cheat sheet helps you do
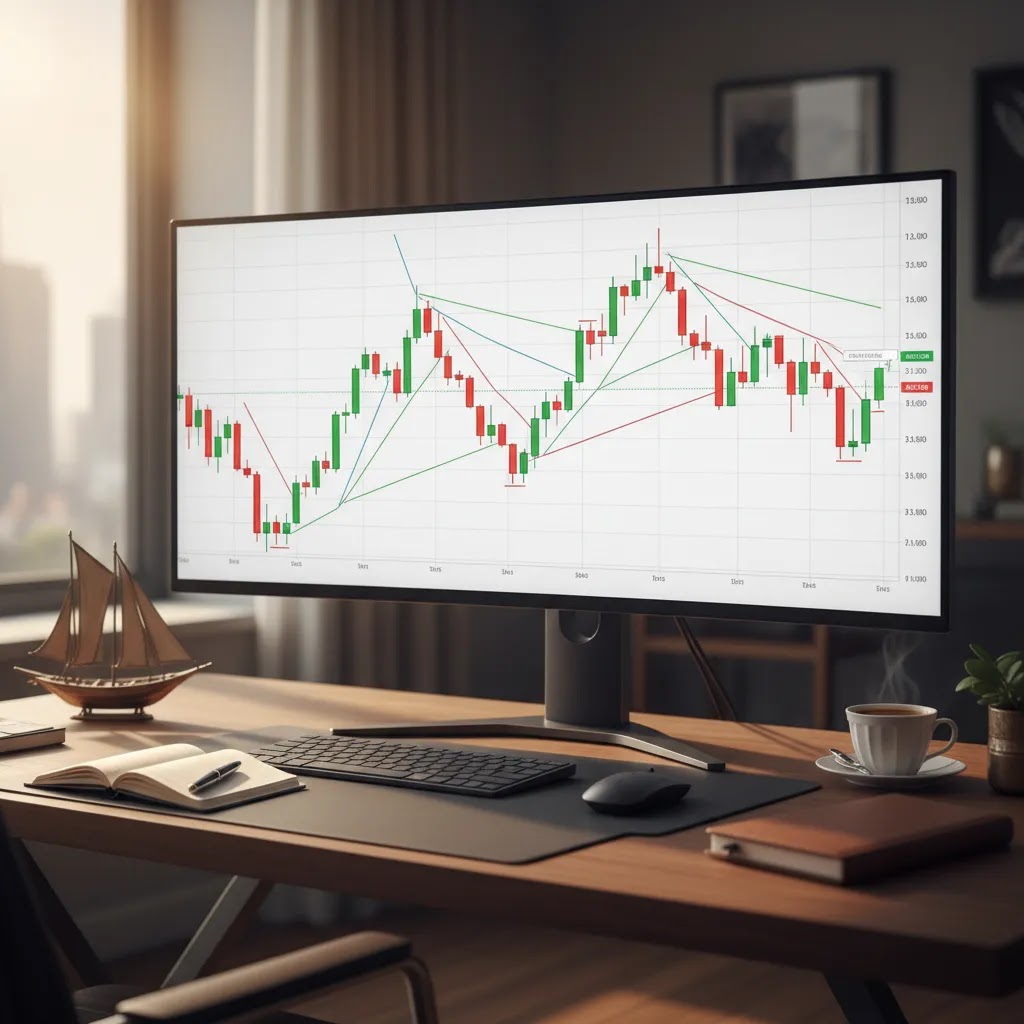
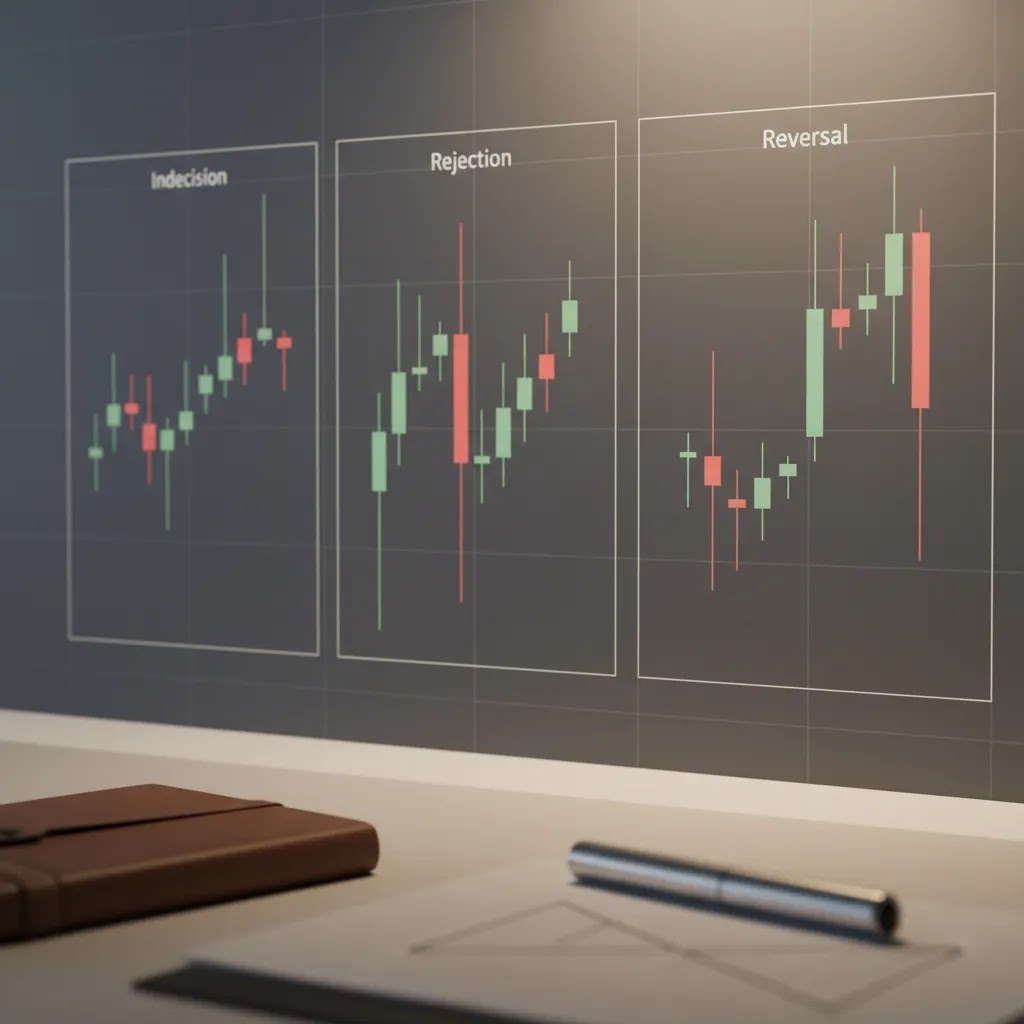
A candlestick cheat sheet is a quick-reference list of recurring price formations shown on a chart. Each candle reflects open, high, low, and close prices for a chosen time period. On their own, candles show momentum and rejection. In sequence, they may suggest continuation, indecision, or reversal.
Most traders use a cheat sheet to speed up recognition. That can be useful, but the real value comes from context. A hammer after a long decline may mean more than a hammer in the middle of a sideways market. An engulfing pattern near a major support level may carry more weight than the same pattern in a noisy range.
If you are still building your chart-reading skills, it also helps to compare candlesticks with broader chart patterns and with the logic behind price action trading. For forex traders, knowing how to read forex charts may reduce the risk of treating every candle as a trading signal.
Risk still matters. Candlestick patterns do not predict outcomes with certainty. Markets can reverse unexpectedly, break through key levels, or react sharply to news. Capital is at risk in any leveraged trading activity.
Candlestick pattern psychology: what each candle is showing
Here’s the thing: candlestick patterns are easier to use when you stop treating them like icons and start treating them like evidence. Each candle is a short story about where price traded during the session and where it ended up. That story can hint at who had control, where traders got trapped, and where price was rejected, but only in relation to what came before it.
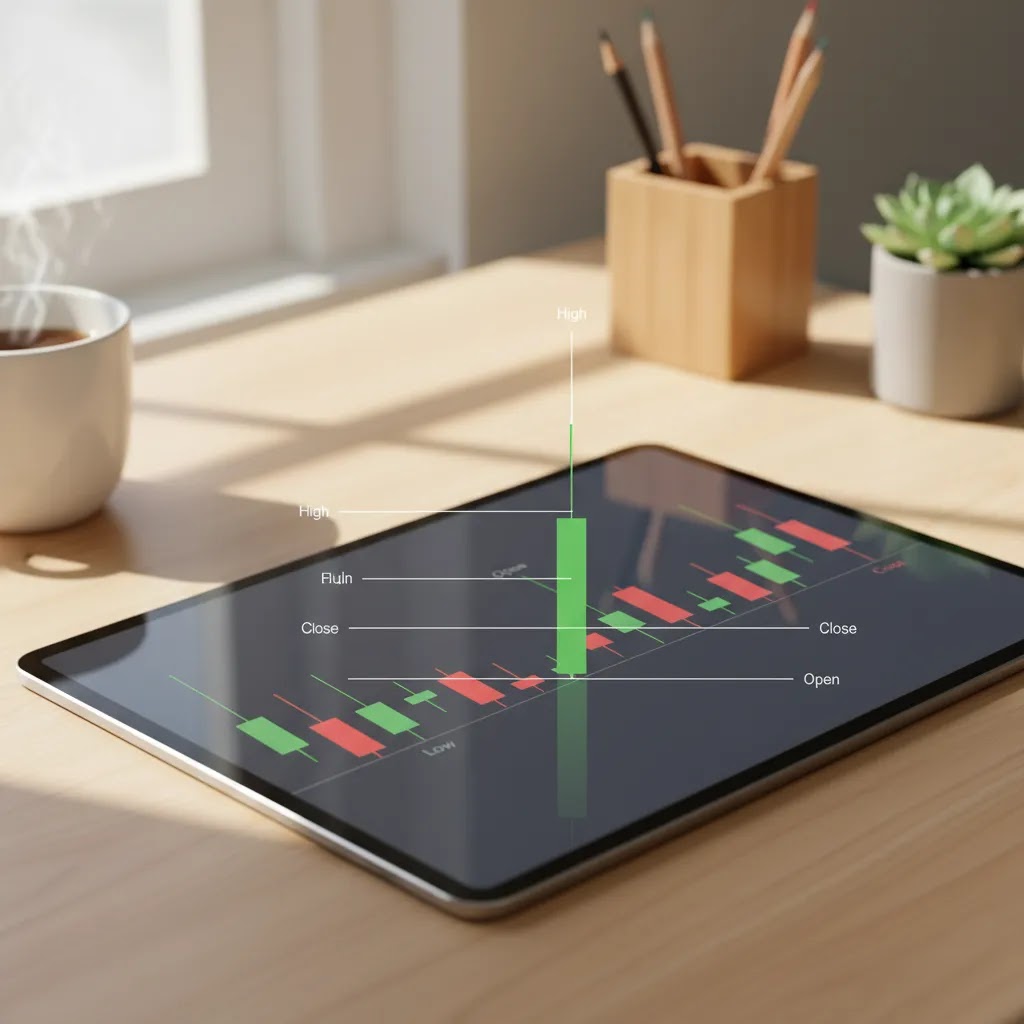
The basic anatomy has three parts. The real body shows the distance between the open and the close, which traders often read as directional conviction for that time period. The upper wick shows how far price traded above the body before being pushed back, which may suggest rejection of higher prices. The lower wick shows how far price traded below the body before recovering, which may suggest rejection of lower prices.
Candle color is usually a simple rule: bullish if the close is above the open, bearish if the close is below the open. That said, platforms can display colors differently, and some chart themes swap green and red for other colors. From a practical standpoint, the open and close relationship matters more than the color you see on screen, so it is worth checking your platform settings if you are learning patterns for the first time.
Wicks are also relative. A “long wick” has meaning because it is long compared to recent candles or compared to the usual volatility on that market and timeframe. In a quiet session, a wick might stand out. In a high-volatility period, the same wick could be normal noise. This is one reason patterns can fail around major news events, where the entire range expands and many candles show exaggerated shadows.
What many people overlook is that a candle is not a reversal by itself. A hammer can show strong rejection of lower prices, but it can still be followed by another push down if the broader trend is bearish or if price is not at a meaningful level. The same is true for dojis: they often show indecision, but indecision is common in ranges, so the signal can be weak without trend exhaustion, a key level, or follow-through.
Think of it this way: patterns are best read as a change in behavior, not a prediction. If the behavior change appears after a clear trend, at an obvious support or resistance area, and is followed by confirmation, it may deserve attention. If it appears in the middle of random chop, it may just be the market doing what it normally does.
20 candlestick patterns every trader should know
Below is a practical candlestick patterns cheat sheet covering widely used Japanese candlestick patterns. Think of these as probability clues, not guarantees.
| Pattern | Type | Typical Signal | What Traders Watch For |
|---|---|---|---|
| Hammer | Bullish | Possible reversal after decline | Long lower wick, small body near top |
| Inverted Hammer | Bullish | Possible reversal after decline | Long upper wick, confirmation often needed |
| Bullish Engulfing | Bullish | Momentum shift upward | Second candle fully covers prior bearish body |
| Piercing Line | Bullish | Recovery from selling pressure | Second candle closes above midpoint of first |
| Morning Star | Bullish | Three-candle reversal pattern | Strong bearish candle, pause, then bullish recovery |
| Three White Soldiers | Bullish | Sustained upward momentum | Three strong bullish candles in sequence |
| Dragonfly Doji | Bullish/Neutral | Rejection of lower prices | Open and close near highs |
| Bullish Harami | Bullish | Weakening downside momentum | Small candle inside prior bearish body |
| Shooting Star | Bearish | Possible reversal after rise | Long upper wick, small body near low |
| Hanging Man | Bearish | Warning after uptrend | Hammer shape appearing after a rise |
| Bearish Engulfing | Bearish | Momentum shift downward | Second candle fully covers prior bullish body |
| Dark Cloud Cover | Bearish | Loss of buying momentum | Second candle closes below midpoint of first |
| Evening Star | Bearish | Three-candle reversal pattern | Strong bullish candle, pause, then bearish decline |
| Three Black Crows | Bearish | Sustained selling pressure | Three strong bearish candles in sequence |
| Gravestone Doji | Bearish/Neutral | Rejection of higher prices | Open and close near lows |
| Bearish Harami | Bearish | Weakening upside momentum | Small candle inside prior bullish body |
| Doji | Neutral | Indecision | Open and close near same level |
| Spinning Top | Neutral | Balance between buyers and sellers | Small body with upper and lower wicks |
| Marubozu Bullish | Bullish | Strong trend continuation | Little or no wick, strong close |
| Marubozu Bearish | Bearish | Strong trend continuation | Little or no wick, strong bearish close |
1) Hammer candle
A hammer candle has a small real body near the top of the range and a long lower wick. It may suggest that sellers pushed price lower, but buyers recovered into the close. Traders often look for it after a decline and near support.
2) Inverted hammer
This candle shows a small body with a long upper wick after a downtrend. It can hint at growing buying interest, but confirmation from the next candle is usually important because the close is still relatively weak.
3) Bullish engulfing pattern
A bullish engulfing pattern appears when a strong bullish candle fully covers the previous bearish body. It may indicate that buyers have taken short-term control. It tends to matter more when volume rises or the pattern forms near a known support area.
4) Piercing line
This is a two-candle bullish reversal setup. The second candle opens lower but closes above the midpoint of the first bearish candle. It may reflect a partial but meaningful shift in sentiment.
5) Morning star
The morning star is a three-candle bullish reversal pattern. It usually consists of a strong bearish candle, a smaller indecisive candle, and then a strong bullish candle. Traders often watch it after extended weakness.
6) Three white soldiers
Three white soldiers form as three consecutive bullish candles with strong closes. This pattern may indicate a durable move higher, though traders should still check whether price is already overextended.
7) Dragonfly doji
A dragonfly doji has little or no upper wick, with open and close near the high. It may show rejection of lower prices, especially if it appears at the end of a selloff.
8) Bullish harami
This pattern places a small candle inside the body of a previous bearish candle. It may signal fading downside momentum, but it is usually weaker than engulfing patterns and often needs confirmation.
9) Shooting star candle
A shooting star candle has a small body near the low and a long upper wick. It appears after an advance and may show that buyers lost control near higher prices.
10) Hanging man
The hanging man looks like a hammer, but it appears after an uptrend. That shift in context changes its meaning. It may warn that sellers are starting to push back.
11) Bearish engulfing pattern
This is the bearish version of the engulfing pattern. A large bearish candle fully covers the prior bullish body, suggesting that downside pressure may be increasing.
12) Dark cloud cover
This two-candle setup begins with a strong bullish candle, followed by a candle that closes below the midpoint of the first. It may signal that upward momentum is weakening.
13) Evening star
The evening star is a common three-candle bearish reversal formation. It often appears after a rally and may indicate a transition from buying strength to selling pressure.
14) Three black crows
Three black crows are three strong bearish candles in a row. They may indicate a steady shift lower, especially after a mature uptrend.
15) Gravestone doji
A gravestone doji has open and close near the low with a long upper shadow. It may suggest rejection of higher prices and is often watched for bearish reversal potential.
16) Bearish harami
A small candle inside a previous bullish candle body may imply fading upside momentum. This pattern is usually interpreted as an early warning, not a decisive signal on its own.
17) Doji candle
A doji candle forms when open and close are nearly equal. It reflects indecision. In trend exhaustion zones, a doji may matter more than in random sideways movement.
18) Spinning top candle
A spinning top candle has a small body and noticeable wicks on both sides. It often reflects short-term balance between buyers and sellers and may precede either continuation or reversal depending on context.
19) Bullish marubozu
A bullish marubozu has little or no wick and a strong close near the high. It generally signals persistent buying pressure and may support a continuation view.
20) Bearish marubozu
A bearish marubozu closes near the low with little or no wick. It may reflect strong selling conviction and is often treated as a continuation signal in a falling market.
If you want a broader breakdown of candlestick patterns, that resource can help you go deeper into confirmation, structure, and false signals.
How to use candlestick patterns more safely
Many beginners lose money by memorizing all candlestick patterns but ignoring context. A better approach is to apply a simple filter before you act on any setup.
- Check the trend first. Reversal patterns tend to matter more after a clear trend than in random consolidation.
- Mark nearby support and resistance. A hammer at support may carry more weight than a hammer in the middle of a range.
- Wait for confirmation. The next candle, a break of structure, or improving momentum may reduce false signals.
- Watch the timeframe. A one-minute doji may be far less meaningful than the same pattern on a four-hour or daily chart.
- Control risk. No candlestick setup is certain. Position size, stop placement, and exposure matter more than pattern memorization.
This is where broader technical analysis becomes useful. Candles are one tool, not a complete trading framework. Traders who combine market structure, trend direction, and disciplined risk controls may avoid some of the common mistakes that come from acting on a single candle alone.
How to use this as a real cheat sheet (filters, grouping, and a quick decision workflow)
Consider this: the fastest way to use a candlestick cheat sheet is not to scan all 20 patterns every time. It is to group them so you can narrow your options quickly, then apply a consistent confirmation process so you are not reacting emotionally to a single candle.
One practical way to organize this list is by how many candles are involved and what the pattern is typically trying to communicate. Single-candle reversal candidates include the hammer, inverted hammer, shooting star, and hanging man. Two-candle reversal candidates include bullish engulfing, bearish engulfing, piercing line, dark cloud cover, bullish harami, and bearish harami. Three-candle reversal candidates include morning star, evening star, three white soldiers, and three black crows.
Continuation cues often include bullish and bearish marubozu, especially when they appear in the direction of an established trend. Indecision patterns include doji, spinning top, dragonfly doji, and gravestone doji. These tend to be most useful as context markers, for example, spotting hesitation at a key level, rather than as stand-alone “buy” or “sell” signals.
From a practical standpoint, you can treat the cheat sheet like a quick decision workflow. First, identify whether the market is trending or ranging on the timeframe you trade. Second, mark the nearest obvious support and resistance zones, because pattern quality often improves at levels that other traders may also be watching. Third, look for a trigger candle or trigger sequence, such as an engulfing pattern at support or a shooting star at resistance.
Next comes confirmation, which is where many false signals get filtered out. Some traders look for a break of structure, for example, a higher high after a bullish reversal pattern or a lower low after a bearish reversal pattern. Some look for volume to expand on the reversal or on the confirmation candle, which can suggest stronger participation, although volume can be less straightforward in some CFD and spot forex feeds. Many traders also do a quick top-down check, such as confirming that a setup on a lower timeframe is not directly trading into a major daily level or against a strong higher-timeframe trend.
Finally, define what would prove the pattern wrong before you consider any position sizing. That could be a level where the pattern is invalidated, such as price trading below the low of a hammer or above the high of a shooting star. The reality is that even well-formed patterns can fail, especially in high-volatility conditions, so risk caps and exposure limits matter more than the name of the pattern you spotted.
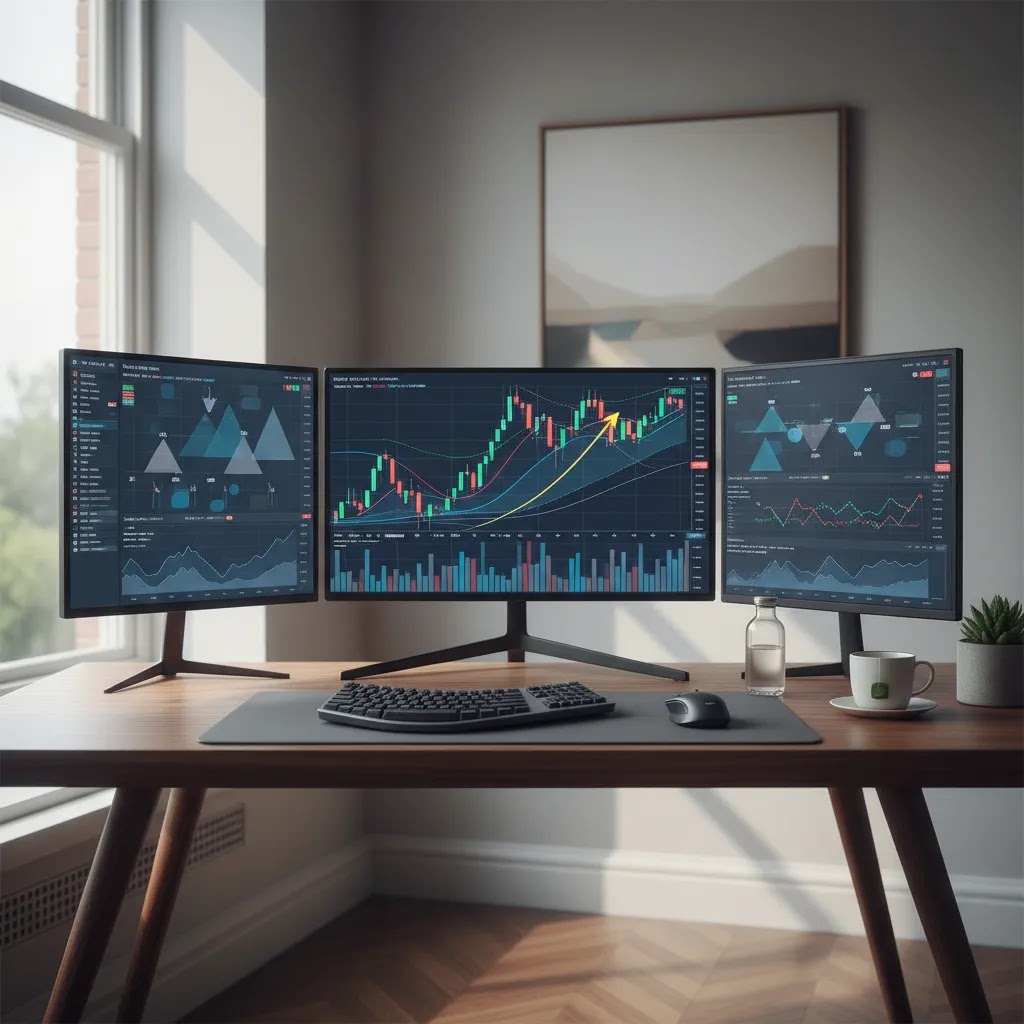
Charting tools and broker context for UAE traders
Your chart reading is only as usable as the platform you apply it on. For UAE-based readers comparing brokers, the chart package, execution environment, and regulatory standing may matter just as much as the pattern itself. Business24-7 covers a range of regulated brokers with different platform strengths.
Pepperstone offers MT4, MT5, cTrader, and TradingView, with spreads from 0.0 pips on Razor and DFSA, FCA, ASIC, CySEC, and BaFin regulation. That may appeal to active traders who rely heavily on chart detail and fast execution. AvaTrade supports MT4, MT5, AvaTradeGO, and WebTrader, with spreads from 0.9 pips and ADGM FSRA regulation relevant to UAE readers. XTB uses xStation 5 and has spreads from 0.1 pips, while Capital.com provides its own web and mobile platform plus MT4, with SCA regulation in the UAE and a low $20 minimum deposit.
eToro may suit users who want simpler chart access alongside social features such as Copy Trading and Smart Portfolios, though its WebTrader setup is less specialized than a multi-platform environment. Interactive Brokers offers professional-grade tools and access to 150+ markets, but its interface may feel demanding for newer traders. Plus500 focuses on simplicity and risk management tools, while ADSS stands out for SCA regulation and UAE headquarters. Exness offers low entry thresholds and instant withdrawals, though traders should pay attention to the specific entity and conditions that apply. Saxo Bank provides deep market access and premium research, but its $2,000 minimum deposit may place it outside the comfort zone of some beginners.
If you are comparing platforms for chart-based trading, browse Business24-7’s Technical Analysis resources alongside our Trading Fundamentals content. For broker-specific research, it may also help to review regulation under bodies such as the DFSA, SCA, FCA, ASIC, or CySEC before opening an account.
Business24-7 aims to be a useful reference point for UAE traders who want clear, unbiased platform research before committing funds. That includes practical education as well as broker reviews. If you are using candlestick setups to compare real trading environments, explore our platform and broker resources first, then check the detailed review for any provider you are considering.
Pros and Cons
Strengths
- A candlestick cheat sheet helps you recognize common patterns quickly without memorizing every setup from scratch.
- Many candlestick signals are easy to combine with support, resistance, trendlines, and broader price action methods.
- Patterns such as the hammer, doji candle, engulfing pattern, morning star, evening star, and spinning top candle are widely used across forex, stocks, commodities, and indices.
- Candlestick analysis works on most modern trading platforms, including MT4, MT5, cTrader, TradingView, xStation 5, and proprietary broker platforms covered by Business24-7.
- The method is visual and beginner-friendly, which may make it easier to build chart-reading discipline over time.
Considerations
- Candlestick patterns can produce false signals, especially in low-volume or choppy markets.
- A single pattern rarely gives enough information on its own, so relying only on candles may lead to poor decisions.
- Short timeframes may create more noise, which can reduce the reliability of patterns such as dojis and spinning tops.
- Even strong-looking patterns do not remove market risk, slippage, or the possibility of sudden news-driven reversals.
Frequently Asked Questions
What is the best candlestick pattern for beginners?
Most beginners start with the hammer, shooting star, bullish engulfing, bearish engulfing, and doji because they are easier to recognize. Even so, no single pattern is best in every market. It is usually safer to learn a small set well and apply them with support, resistance, and trend context rather than trying to trade every setup you see.
Do candlestick patterns really work?
Candlestick patterns may be useful as probability-based signals, but they do not work all the time. Their reliability often depends on market conditions, timeframe, trend structure, and confirmation. In most cases, traders who combine candlesticks with broader analysis and risk management may get more consistent decision-making than those who rely on patterns alone.
What is a doji candle telling me?
A doji candle typically shows indecision because the open and close are close together. Buyers and sellers have reached a temporary balance. That may matter more after a strong trend, where it could hint at exhaustion, than inside a sideways range where indecision is already common.
Is a hammer candle always bullish?
No. A hammer candle may suggest bullish rejection only if it appears after a decline and ideally near support. In the wrong context, it can be meaningless. Traders often wait for the next candle to confirm that buyers are actually following through before treating it as a stronger signal.
What is the difference between a hammer and a hanging man?
The shape is very similar, but the location changes the interpretation. A hammer appears after a decline and may suggest a bullish reversal. A hanging man appears after an uptrend and may warn of weakening buying pressure. Context is what separates the two.
Are Japanese candlestick patterns useful for forex trading?
Yes, many forex traders use Japanese candlestick patterns because they are clear and flexible across timeframes. That said, forex prices can react quickly to economic releases and central bank news, so patterns may fail without warning. Learning candle structure should be paired with an understanding of volatility and event risk.
Can I use all candlestick patterns on mobile trading apps?
Usually yes, if the app provides candlestick chart mode and allows timeframe changes. Platforms such as eToro, Plus500, XTB, Capital.com, AvaTradeGO, and IBKR Mobile all support chart access, though the depth of analysis tools may vary. Advanced chart users may still prefer desktop platforms like MT4, MT5, cTrader, TradingView, or TWS.
Which broker platforms are better for chart-based traders in the UAE?
That depends on your experience and priorities. Pepperstone may suit traders who want MT4, MT5, cTrader, and TradingView access. AvaTrade and XTB may appeal to users who want education plus practical charting. Capital.com has a low minimum deposit and SCA regulation. Always compare fees, regulation, and platform usability before choosing.
Should I download a candlestick patterns PDF?
A printable candlestick patterns PDF can be useful for revision, but it should not replace actual chart practice. The most helpful cheat sheets are simple and visual, then reinforced with live chart observation. Recognition improves when you study how patterns behave in trending, ranging, and high-volatility conditions.
What are the most reliable candlestick patterns?
No candlestick pattern is reliable in every market because outcomes depend on context, confirmation, and volatility. Traders often find that multi-candle reversal patterns such as the morning star, evening star, bullish engulfing, and bearish engulfing can be more informative than a single-candle signal, especially when they form near clear support or resistance and are followed by confirmation. Even then, false signals are common, so risk management still matters.
Which candlestick patterns are bullish and bearish?
Many cheat sheets classify patterns by their typical direction. Bullish candlestick patterns often include the hammer, inverted hammer, bullish engulfing, piercing line, morning star, and three white soldiers. Bearish candlestick patterns often include the shooting star, hanging man, bearish engulfing, dark cloud cover, evening star, and three black crows. Patterns like doji and spinning top are usually treated as neutral because they highlight indecision rather than direction.
How do I memorize candlestick patterns quickly?
Memorization tends to improve when you learn patterns in groups and tie them to the story they are telling. For example, engulfing patterns show one side overpowering the other, and dojis show balance. Many traders also learn faster by marking examples on charts, taking screenshots, and reviewing the same pattern across different trends and volatility conditions. A cheat sheet works best as a reference while you practice, not as something you try to memorize in one sitting.
Are candlestick patterns enough for day trading?
Candlesticks alone are rarely enough for consistent day trading decisions because short timeframes can be noisy and spreads, slippage, and sudden news moves can distort signals. Many day traders combine candlestick patterns with market structure, key levels, and a clear risk plan, and they typically avoid relying on any single candle as proof of direction. Any active trading approach involves real risk, so readers should consider their own experience and circumstances before putting money at stake.
Downloadable and printable cheat sheet guidance (and how to avoid bad PDFs)
A printable cheat sheet can be useful, but quality varies a lot. A strong PDF is not the one with the most patterns, it is the one that reminds you how to read patterns in context and how to avoid the most common misreads.
A good candlestick cheat sheet PDF typically includes clear, labeled candle drawings, the pattern name, and a short note about where it tends to matter most, such as after a trend or near support and resistance. It also helps when the sheet includes a simple reminder about confirmation, for example, waiting for follow-through, a break of structure, or alignment with a higher timeframe. Some of the most useful printables also show invalidation examples, meaning what it looks like when the setup fails, because that is often where risk control starts.
Red flags are usually easy to spot. If a cheat sheet makes “signal-like” claims that a pattern always works, or if it ignores trend and level context entirely, it can push beginners toward overconfidence. Low-quality sheets also tend to show only one perfect version of each pattern and ignore common variations, which matters because real charts rarely print textbook candles.
To practice with a cheat sheet effectively, treat it like a training wheel. Mark up charts and label patterns you see in real time, then take screenshots and review them later with fresh eyes. Try to study the same pattern during different market regimes, such as trending periods versus ranges, and during low versus high volatility. Over time, you may start recognizing which patterns tend to work better for the instruments and timeframes you follow, without assuming the market owes you a predictable outcome.
Key Takeaways
- A candlestick cheat sheet is most useful as a quick reference, not as a stand-alone trading system.
- Patterns such as the hammer candle, doji candle, engulfing pattern, morning star, evening star, and three white soldiers are widely followed.
- Context matters more than memorization. Trend, support and resistance, timeframe, and confirmation all affect pattern quality.
- UAE traders should also compare charting platforms, fee structures, and regulation under bodies such as the DFSA and SCA before opening an account.
- Trading involves real risk, and no candlestick setup can guarantee a profitable outcome.
Conclusion
A strong candlestick patterns cheat sheet can make your chart review faster, but better decisions usually come from combining patterns with structure, discipline, and platform awareness. If you are still learning, focus on a smaller candlestick patterns list first and practice reading them in context rather than chasing every signal. For UAE-based traders, it also makes sense to evaluate whether your broker’s charting tools, fees, and regulation actually support the way you trade. Business24-7 is built to help readers do that with clearer, safety-focused research. If you are narrowing down platforms for technical trading, browse our educational resources, compare broker features carefully, and check the full review before opening an account.
Disclaimer: The content published on Business24-7 is intended for informational purposes only and does not constitute financial advice, investment recommendations, or an endorsement of any specific platform or financial product. Trading and investing carry significant risk, including the potential loss of capital. You should conduct your own research and, where appropriate, seek independent financial advice before making any investment decisions. Business24-7 does not accept responsibility for any financial losses incurred as a result of information published on this site.
Disclaimer
eToro is a multi-asset platform which offers both investing in stocks and cryptoassets, as well as trading CFDs.
Please note that CFDs are complex instruments and come with a high risk of losing money rapidly due to leverage. 61% of retail investor accounts lose money when trading CFDs with this provider. You should consider whether you understand how CFDs work, and whether you can afford to take the high risk of losing your money
This communication is intended for information and educational purposes only and should not be considered investment advice or investment recommendation. Past performance is not an indication of future results.
Copy Trading does not amount to investment advice. The value of your investments may go up or down. Your capital is at risk.
Crypto assets are complex and carry a high risk of volatility and loss. Trading or investing in crypto assets may not be suitable for all investors. Take 2 mins to learn more
eToro USA LLC does not offer CFDs and makes no representation and assumes no liability as to the accuracy or completeness of the content of this publication, which has been prepared by our partner utilizing publicly available non-entity specific information about eToro.
If you trade forex, stocks, gold, or indices, reading candlesticks well may help you make calmer, more structured decisions. A good candlestick cheat sheet gives you a fast way to recognize common bullish and bearish signals, but patterns should never be used in isolation. For UAE-based traders especially, where many people are comparing platforms, chart tools, and risk controls before…