Learn how the Moving Average Convergence/Divergence (MACD) indicator reveals the relationship between two moving averages of a security’s price. Master this momentum indicator to enhance your trading strategy and make informed decisions.
Over time, trading has evolved both technically and fundamentally with the advancement in technology, and various new tools have emerged. Technical analysis, especially, has seen robust developments in advanced technology with thousands of indicators.
The Moving Average Convergence Divergence (MACD) is a momentum oscillator that measures the relationship between two exponentially smoothed moving averages of a security’s price. It is a technical indicator used by traders to identify trends, momentum shifts, and potential trading opportunities within the price movements of a financial asset.
The MACD is derived from the calculation of two exponential moving averages (EMAs) of an asset’s price and the subsequent analysis of their relationship.
Purpose Of MACD
The primary objective of MACD is to help traders identify price trends and reversal points where the trend can change direction. With the help of MACD, traders can time their entry and exits. MACD can also be used with other indicators, like price volume, for confirmation.
How is MACD Calculated?
The foundational base of MACD is the exponential moving average used in them. MACD is calculated through a series of mathematical steps involving 12-period and 26-period exponential moving averages (EMAs). The formula for MACD is:
MACDp = EMA12(p) – EMA26(p)
As you can see, subtracting the 26-period EMA from the 12-period EMA of the asset’s closing prices gives the final MACD line. Subsequently, a nine-period EMA of the MACD line, which is called the signal line, is calculated. The difference between the MACD line and the signal line is plotted as a histogram, providing a visual representation of their relationship. There is a zero line in MACD, which indicates the positive or negative momentum in the price.
Also, the exponential smoothing used in MACD assigns greater weight to recent price data, making the indicator more responsive to price changes compared to simple moving averages. This price sensitivity enhances the MACD’s ability to capture momentum shifts and potential trend reversals.
What are the Key Components of MACD?

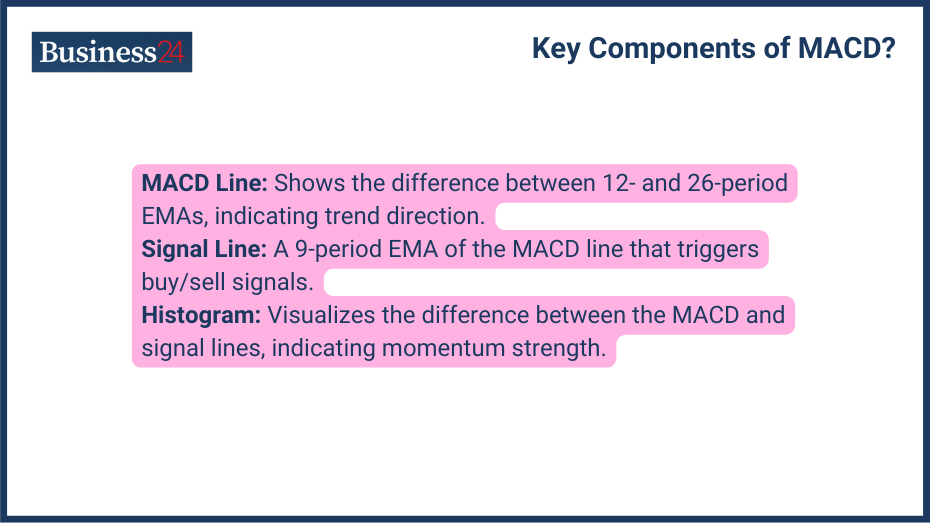
Key components of MACD are:
- MACD Line: The most important part of the indicator is the MACD line. It represents the difference between 12—and 16-period EMAs. When the MACD line is positive, it suggests an upward trend, while a negative value indicates a downward trend.
- Signal Line: The signal line is a nine-period EMA of the MACD line and acts as a trigger for buy and sell signals. When the MACD line crosses above the signal line, it often signals a potential upward trend, indicating a bullish market. On the other hand, when the MACD line crosses below the signal line, it usually points to a potential bearish trend.
- Histogram: The histogram is a graphical representation of the difference between the MACD line and the signal line. A tall, positive histogram suggests strong bullish momentum, while a tall, negative histogram indicates strong bearish momentum.
How Does MACD Work?
MACD has different workings and methods of interpretation; here are the key mechanisms of MACD that will help you understand its working:
Crossover Signals
One of the most used methodologies in MACD is the crossover signal. To detect the crossover signal, you have to observe the crossovers between the MACD line and the signal line. There are two types of crossover signals:
- Bullish Crossover: The MACD forms a bullish crossover when the MACD line crosses above the signal line, suggesting a potential uptrend in the rice or more strength to the existing trend. Traders use the bullish crossover to identify a buying opportunity and place a trade at the crossover signal.
- Bearish Crossover: Conversely, when the MACD line crosses below the signal line, it is interpreted as a bearish signal, indicating a potential downward trend or a weakening of the existing uptrend. Traders can use the bearish crossover to take a short position.
Zero Line Crossover
The MACD line moves above and below the zero line, also known as the baseline. When it crosses above the zero line, it shows that the short-term moving average 12-period EMA is now above the long-term moving average 26-period EMA, which could signal bullish momentum. On the other hand, if the MACD line drops below the zero line, it indicates that the short-term moving average has fallen below the long-term one, pointing to potential bearish momentum.
Divergence
Divergence is a condition when the price movement of an asset and the MACD moves in opposite directions:
- Bullish Divergence: When the price makes a lower low, but the MACD makes a higher low just opposite of the price. The situation indicates a potential bullish reversal, as the underlying momentum is stronger than the price action indicates.
- Bearish Divergence: Bearish divergence occurs when the price makes a higher high, but the MACD makes a lower high. It suggests a potential bearish reversal, as the underlying momentum is weaker than the price action indicates.
What is a good MACD signal?
There is no specific “good MACD signal.” However, a situation interpreted with confirmation with MACD could be a good signal to buy, sell, or manage the trade. For example, a decisive crossover of the MACD line above the signal line (bullish) or below the signal line (bearish) without significant hesitation or false starts can be a good signal.
How do you read the MACD?
To read the MACD, you have to interpret the MACD line, signal line, and histogram in conjunction. The interpretation of the MACD line and zero line is that whenever the MACD line crosses above the zero line, it is interpreted as a bullish indication, while the MACD line crossing below the zero line is interpreted as a bearish signal.
The interpretation of the MACD line and signal line forms when the MACD line crosses above the signal line; this is also known as a bullish crossover and indicates the trend change in the upside. The Opposite of the bullish crossover is the bearish crossover; in it, the MACD line crosses below the signal line from above and gives the potential indication of the bearish trend change.
Interpretation with histogram is that a tall, positive histogram indicates strong bullish momentum, while a tall, negative histogram suggests strong bearish momentum. When the price and MACD move in opposite directions, it can indicate a potential trend reversal.
What are the Benefits of Using MACD?

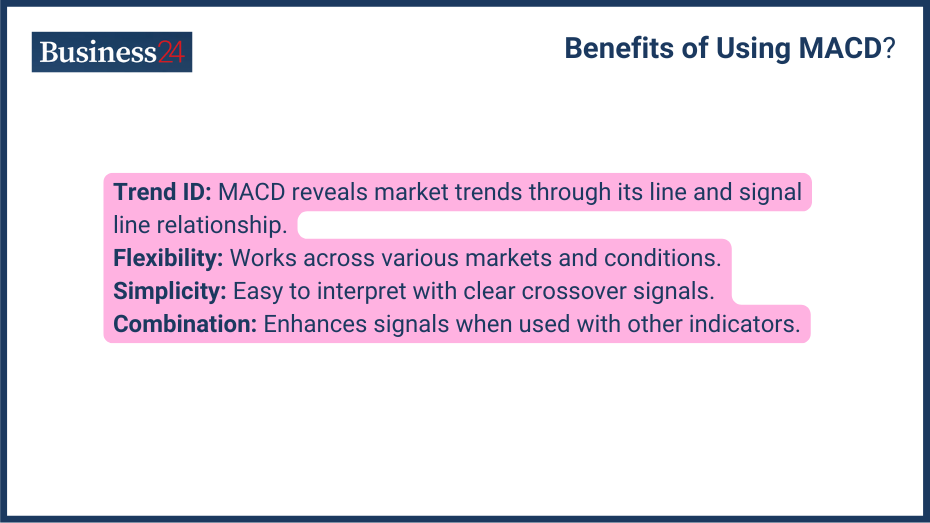
Benefits of using MACD:
Trend Identification
Traders use the MACD mainly because of its ability to help identify the prevailing trend in price. Trend identification, whether continuation or reversal, becomes important in entry and exits, which can be interpreted by the relationship between the MACD line and the signal line. With the help of strong signals used with confirmation, traders can identify the market’s trend upward, downward, or consolidating.
The MACD provides valuable information about the strength and direction of price momentum. A diverging MACD can indicate a potential change in trend, while a converging MACD might suggest a weakening of the current trend.
Flexibility
The MACD can be applied to a wide range of financial instruments, including stocks, commodities, currencies, and indices, making it a versatile tool for traders operating in different markets. It can be used not only in the trending market but also in the range-bound market.
Simplicity
Compared to some other technical indicators, the MACD is relatively straightforward to understand and interpret. The crossover between the MACD line and the signal line gives a clear signal, and the visual representation of the histogram provides a clear overview of the relationship between the moving averages.
Combination with Other Indicators
The MACD can be effectively combined with other technical indicators to enhance the accuracy of trading signals. For example, using the MACD in conjunction with support and resistance levels or other momentum oscillators can provide additional confirmation of potential trading opportunities.
What are the Limitations of MACD?
Limitations of MACD:
Lagging Indicator
Every indicator is based on price, and price moves first. Then, based on the price, the indicator is formed, which makes its nature lagging. Since it’s based on moving averages, which incorporate historical price data, the MACD tends to generate signals after a price trend has already established itself. This lag can sometimes result in missed trading opportunities or delayed entry and exit points.
False Signals
The MACD can produce false signals, particularly in choppy or ranging markets. Frequent crossovers between the MACD line and the signal line can occur without leading to significant price movements, generating misleading buy or sell signals. These false signals can, over time, mount losses and result in eating profits.
Sensitivity to Market Conditions
The effectiveness of the MACD can vary depending on market conditions. In highly volatile markets, the MACD may generate numerous false signals, while in sideways markets, it may produce little to no signal.
How to Use MACD for Trading?
The MACD offers a versatile framework for generating trading signals that traders can use for trading:
Confirming Trends
The MACD can be used to confirm existing trends. If the price is trending upward and the MACD is above the zero line with a positive histogram, it reinforces the bullish trend. Conversely, if the price is trending downward and the MACD is below the zero line with a negative histogram, it supports the bearish trend.
Identifying Divergences
The divergence between the price and the MACD can signal potential trend reversals. A bullish divergence occurs when the price makes a lower low, but the MACD makes a higher low, suggesting a potential bullish reversal. A bearish divergence occurs when the price makes a higher high, but the MACD makes a lower high, indicating a potential bearish reversal.
Setting Stop-Loss Orders
To manage risk, traders should use stop-loss orders in conjunction with the MACD. A stop-loss order automatically exits a position when the price reaches a predetermined level, limiting potential losses.
What are the Practical Applications of MACD?
MACD has various practical applications in different asset classes. The MACD determines a stock’s overall trend, whether it’s in an uptrend, downtrend, or sideways market. The MACD can also confirm chart patterns such as head-and-shoulders, double tops, and double bottoms.
The MACD can also be applied to currency pairs to identify trends and potential reversal points. By observing the extreme values of the MACD histogram, traders can identify potential overbought or oversold conditions. With stocks and forex, MACD can also be applied to different assets like cryptocurrency, index, etc.
What is MACD and RSI?
The Moving Average Convergence Divergence (MACD) and risk are two different concepts in finance. MACD is a technical indicator that helps traders spot potential buy or sell opportunities by comparing short-term and long-term moving averages of a stock’s price. It provides insight into the momentum and direction of a trend.
On the other hand, risk refers to the chance of experiencing a loss or variability in investment returns. It involves the uncertainty and possible negative outcomes that can result from market fluctuations, economic conditions, or specific events. While traders use MACD as a decision-making tool, risk is an inherent part of investing that must be carefully managed.
Educational Resources and Tools
Numerous books dedicated to technical analysis and trading strategies extensively cover the MACD and its applications. Also, many platforms feature experienced traders and analysts who share their knowledge and expertise on using the MACD. Most trading platforms offer advanced charting tools that include the MACD as a standard indicator, allowing traders to analyze price data and generate signals.
Disclaimer
eToro is a multi-asset platform which offers both investing in stocks and cryptoassets, as well as trading CFDs.
Please note that CFDs are complex instruments and come with a high risk of losing money rapidly due to leverage. 61% of retail investor accounts lose money when trading CFDs with this provider. You should consider whether you understand how CFDs work, and whether you can afford to take the high risk of losing your money
This communication is intended for information and educational purposes only and should not be considered investment advice or investment recommendation. Past performance is not an indication of future results.
Copy Trading does not amount to investment advice. The value of your investments may go up or down. Your capital is at risk.
Crypto assets are complex and carry a high risk of volatility and loss. Trading or investing in crypto assets may not be suitable for all investors. Take 2 mins to learn more
eToro USA LLC does not offer CFDs and makes no representation and assumes no liability as to the accuracy or completeness of the content of this publication, which has been prepared by our partner utilizing publicly available non-entity specific information about eToro.